Quick Summary: Email Metrics
- Association emails outperform B2C: Expect 20–25% open rates for engaged member audiences versus 15–18% for commercial email.
- Open rates are less reliable now: Apple Mail Privacy Protection inflates tracking—focus on clicks as the more accurate engagement measure.
- CTOR reveals content quality: Click-to-open rate isolates content effectiveness from subject line performance; aim for 12–18%.
- Trends beat absolutes: An improving 19% open rate is more valuable than a declining 25%—track your direction over time.
- Protect list health: Keep hard bounces under 2% and spam complaints under 0.1% to maintain sender reputation.
Part of our association email marketing guide
"How are we doing with email?" It's a question I hear constantly from association executives. The frustrating truth: it depends on what you're measuring and what you're comparing against.
Association email behaves differently than commercial email. Your members have opted in, already have a relationship with you, and expect regular communication. That changes the benchmarks—and raises the stakes. According to MGI's 2025 Membership Marketing Benchmarking Report, 52% of members who don't renew cite lack of engagement as a primary reason, making your email strategy a critical driver of retention.
After 30 years of working with associations, I've learned that the strongest email programs don't chase broad industry metrics—they track their own performance trends. A 19% open rate that's improving is far more valuable than a 25% rate that's slipping. Your direction matters more than the number itself.
For professional associations, trade groups, and membership organizations—not general B2C or B2B marketers—the sections below highlight the metrics that truly matter, realistic benchmarks for your audience, and what those numbers reveal about your program's overall health.
Why email metrics matter for associations
Email metrics serve three purposes: diagnosing problems, measuring progress, and guiding optimization. But only if you understand what each metric actually tells you. Industry research shows half of associations fail to tailor communications for different member segments—a gap that metrics can help you identify and close.
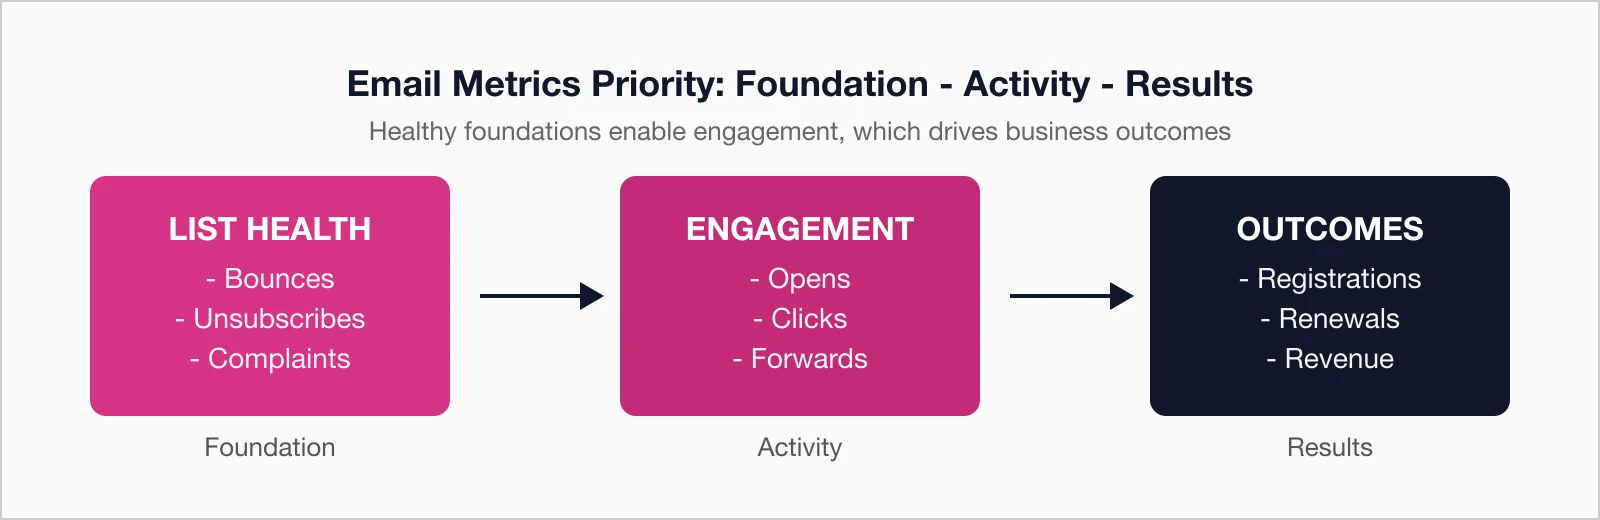
The metrics hierarchy
Not all metrics are equally important. Here's how to prioritize:
- Outcome metrics: Conversions, registrations, renewals, revenue—what actually matters to your association
- Engagement metrics: Opens, clicks, forwards—indicators of content relevance and interest
- Health metrics: Bounces, unsubscribes, spam complaints—signals of list quality and sender reputation
Most reporting focuses on engagement metrics because they're easy to track. But engagement without outcomes is just vanity. Always connect your email metrics to business results.
Open rate
What it is: The percentage of delivered emails that were opened, calculated as (unique opens ÷ emails delivered) × 100.
Association benchmarks
| Performance Level | Open Rate | Interpretation |
|---|---|---|
| Excellent | > 30% | Strong list quality and subject lines |
| Good | 22-30% | Typical for engaged association audiences |
| Average | 18-22% | Room for improvement |
| Below Average | < 18% | Subject line or list quality issues |
What affects open rate
- Subject line: The primary driver of opens—compelling, clear, relevant
- Sender name: Recognized and trusted sender improves opens
- Send time: When your audience checks email
- List quality: Engaged subscribers vs. disengaged or invalid addresses
- Deliverability: Can't open what never arrives
Open Rate Reality Check: Apple Mail Privacy Protection (launched 2021) is designed to protect user privacy by hiding IP addresses and preventing senders from seeing if an email was opened. It works by pre-loading remote content regardless of whether the recipient actually opens the email—which can significantly inflate your reported open rates. If many members use Apple devices, your "real" open rate is likely lower than reported. Focus on clicks as a more reliable engagement metric.
A deeper look: Open rate variations by email type
Different email types typically see different open rates based on urgency and relevance:
- Transactional emails (receipts, confirmations) tend to have the highest open rates—members expect and need them
- Renewal reminders typically perform well due to high personal relevance and urgency
- Event announcements often see strong engagement because they're time-sensitive and actionable
- Newsletters usually fall in the middle—consistent but less urgent
- Promotional emails often have lower rates since members perceive them as less essential
Judge each email type against appropriate benchmarks, not a single standard for all emails.
Click-through rate (ctr)
What it is: The percentage of delivered emails where at least one link was clicked, calculated as (unique clicks ÷ emails delivered) × 100.
Association benchmarks
| Performance Level | CTR | Interpretation |
|---|---|---|
| Excellent | > 5% | Highly relevant content and clear CTAs |
| Good | 3-5% | Solid engagement with content |
| Average | 2-3% | Typical association performance |
| Below Average | < 2% | Content or CTA issues |
What affects click rate
- Content relevance: Does the content deliver on the subject line promise?
- CTA clarity: Is it obvious what to click and why?
- CTA placement: Above the fold gets more clicks
- Link density: Too many links can dilute clicks; too few misses opportunities
- Mobile optimization: Easy to tap on small screens
Click-through rate is more reliable than open rate because it requires intentional action. It can't be inflated by privacy features like Apple Mail Protection.
Click-to-open rate (ctor)
What it is: The percentage of opened emails where at least one link was clicked, calculated as (unique clicks ÷ unique opens) × 100.
CTOR isolates content effectiveness from subject line effectiveness. It answers: "Of the people who opened, how many found the content compelling enough to click?"
Association benchmarks
| Performance Level | CTOR | Interpretation |
|---|---|---|
| Excellent | > 18% | Content highly resonates with audience |
| Good | 12-18% | Content meeting expectations |
| Average | 8-12% | Room for content improvement |
| Below Average | < 8% | Content not delivering on promise |
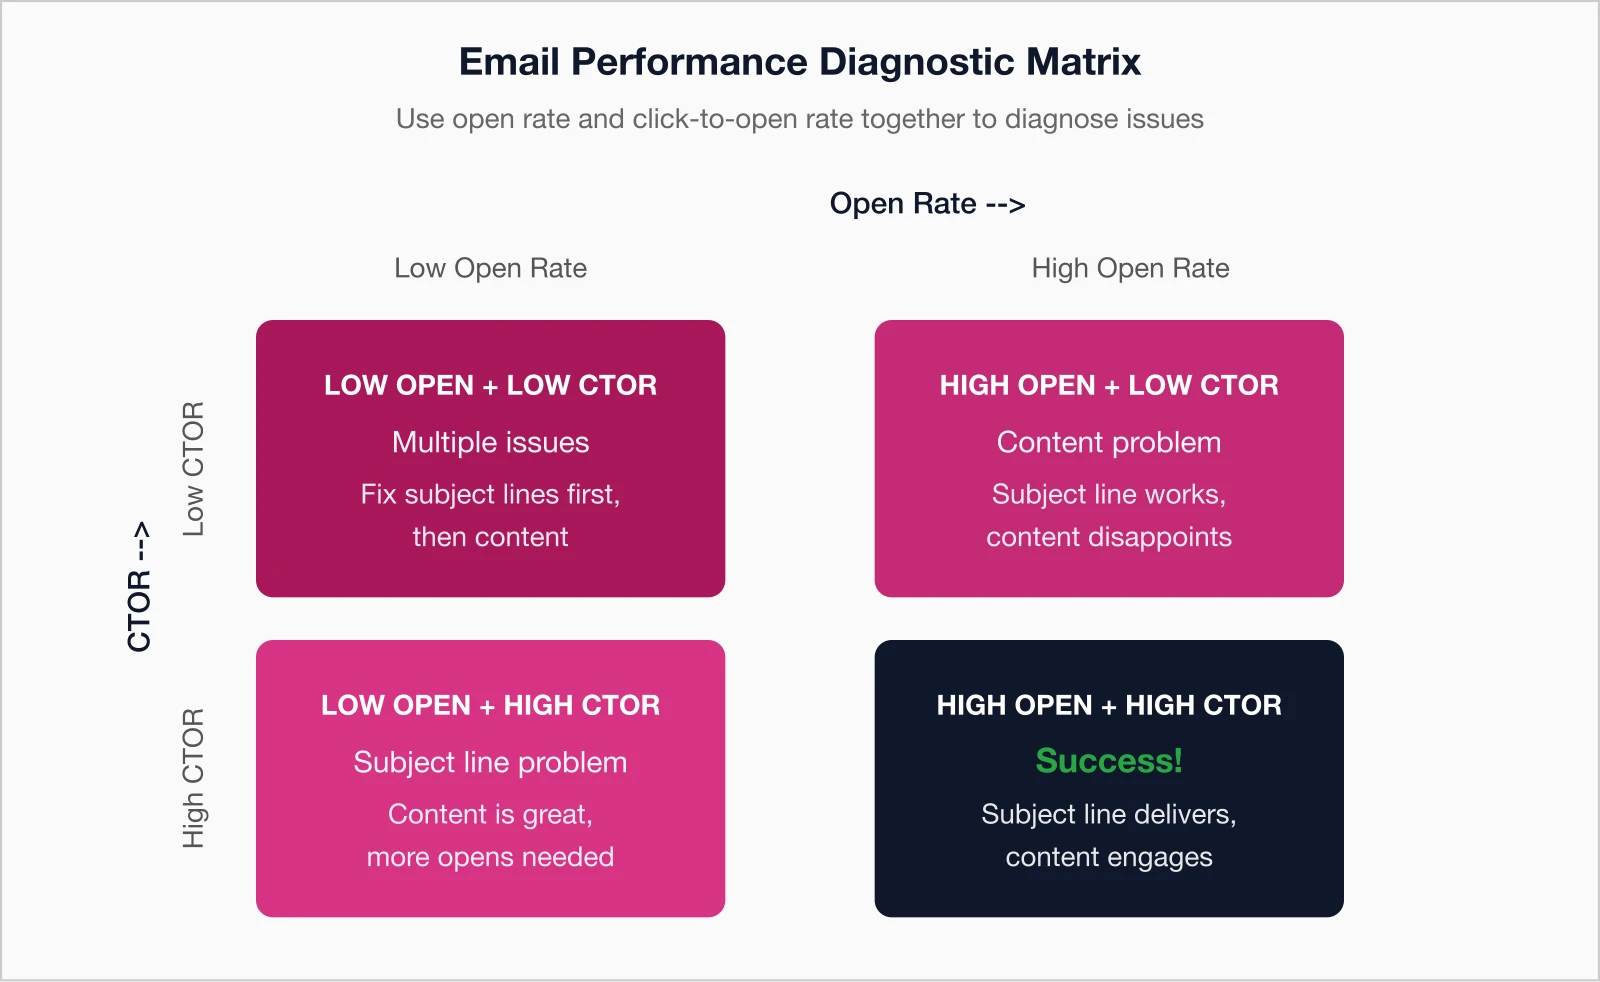
Using ctor for diagnosis
High open rate but low CTOR: Your subject line is working, but your content isn't delivering on its promise. The subject line may be misleading, or the content simply isn't compelling once opened.
Low open rate but high CTOR: Your content is great, but your subject line isn't getting people to open. Focus on subject line testing.
Both low: Multiple issues—start with subject lines (can't fix content engagement if no one opens), then address content.
In my experience, CTOR is where the real insights live. Open rates get all the attention, but they're increasingly unreliable. CTOR tells you whether your content actually resonates once someone gives you their attention. That's the metric worth optimizing.
Bounce rate
What it is: The percentage of emails that couldn't be delivered, calculated as (bounced emails ÷ emails sent) × 100.
Types of bounces
Hard bounces: Permanent failures—address doesn't exist, domain invalid, etc. These should be removed from your list immediately.
Soft bounces: Temporary failures—mailbox full, server temporarily down, message too large. Most platforms retry soft bounces automatically.
Benchmarks
| Metric | Healthy | Concerning | Critical |
|---|---|---|---|
| Hard bounce rate | < 1% | 1-2% | > 2% |
| Total bounce rate | < 2% | 2-5% | > 5% |
What high bounce rates indicate
- Stale list: You haven't emailed in a while, addresses have changed
- Bad data collection: Invalid addresses entering your system
- Purchased list: Bought lists always have high bounce rates
- Missing validation: No email validation at point of collection
High bounce rates damage your sender reputation. Clean your list regularly and validate new addresses before adding them. For more on protecting your sender reputation, see our guide to email deliverability.
Unsubscribe rate
What it is: The percentage of recipients who clicked unsubscribe, calculated as (unsubscribes ÷ emails delivered) × 100.
Benchmarks
| Performance Level | Unsubscribe Rate | Interpretation |
|---|---|---|
| Healthy | < 0.2% | Content meeting expectations |
| Acceptable | 0.2-0.5% | Normal list churn |
| Concerning | 0.5-1% | Frequency or relevance issues |
| Problem | > 1% | Significant mismatch with expectations |
Understanding unsubscribes
Some unsubscribes are healthy—people's circumstances change, and you want an accurate, engaged list. But sudden spikes or consistently high rates indicate problems:
- Frequency mismatch: Sending more often than subscribers expected
- Content drift: Topics straying from what subscribers signed up for
- Quality decline: Less valuable or more promotional content
- Irrelevance: Content not matching subscriber interests
An unsubscribe is actually better than a spam complaint. Make your unsubscribe link easy to find—people who can't easily unsubscribe often mark emails as spam instead.
Spam complaint rate
What it is: The percentage of recipients who marked your email as spam, calculated as (spam complaints ÷ emails delivered) × 100.
Benchmarks
| Complaint Rate | Assessment | Action |
|---|---|---|
| < 0.1% | Healthy | Maintain current practices |
| 0.1-0.2% | Warning | Investigate recent changes |
| 0.2-0.3% | Concerning | Immediate review required |
| > 0.3% | Critical | Risk of deliverability damage |
Spam complaints are the most damaging metric for deliverability. ISPs watch this closely. Google's email sender guidelines require bulk senders to maintain complaint rates below 0.3%—or face delivery problems including permanent message rejections.
Why people hit spam instead of unsubscribe:
- They can't find your unsubscribe link
- Your unsubscribe process is complicated
- They don't remember subscribing
- They're frustrated by volume or irrelevance
Make unsubscribing easy to reduce spam complaints.
Beyond basic metrics: What associations should track
Standard metrics like opens and clicks show if your emails are getting noticed. Advanced metrics reveal the real impact—how they drive registrations, renewals, and revenue for your association.
These deeper insights help you prioritize what matters most, optimize campaigns, and prove email's value to your board and stakeholders. Here's how to move past surface-level data to metrics that tie directly to your goals.
Revenue per email (rpe)
For associations with paid offerings (events, products, certifications), track revenue attributed to email campaigns. Calculate as (total revenue from email ÷ emails sent).
List growth rate
Healthy email programs grow over time. Calculate as ((new subscribers - unsubscribes - bounces) ÷ total subscribers) × 100. A positive rate means you're growing; negative means you're shrinking.
Conversion rate by campaign type
For emails with specific goals (registrations, renewals, etc.), track the conversion rate: (conversions ÷ emails delivered) × 100. Compare across campaign types to identify what works best.
Engagement over time
Track how engagement changes as members age on your list. New subscribers typically show high engagement that gradually declines. Unusual patterns may indicate onboarding problems or content staleness.
A deeper look: Building your own benchmarks
Industry benchmarks are useful starting points, but your best benchmark is yourself. Here's how to build meaningful internal benchmarks:
- Segment your data: Track metrics by email type (newsletter, promotional, transactional), by audience (members vs. prospects, or communications to chapters, sponsors, and volunteers), and by time period
- Establish baselines: Calculate averages for each segment over 3-6 months
- Set improvement targets: Realistic goals based on your baseline, not industry averages
- Track trends: Month-over-month and year-over-year comparisons matter more than absolute numbers
- Note context: Account for seasonal patterns, major events, or list changes when analyzing performance
An association with 18% open rates that grows to 22% is doing better than one that started at 25% and dropped to 20%—even though the latter still has "better" absolute numbers.
Know your numbers, improve your results
Email metrics exist to drive better decisions. Understand what each number tells you, track the metrics that connect to your goals, and focus on trends over time rather than obsessing over industry benchmarks.
The associations that excel at email marketing aren't necessarily the ones with the highest open rates—they're the ones who systematically measure, analyze, and improve. Start with basic metrics, add advanced tracking as your program matures, and always connect email performance to business outcomes.
One final thought: don't let metrics paralyze you. I've seen associations spend months analyzing data instead of actually sending emails. The best email is the one you send, measure, learn from, and improve. Start somewhere, track what matters, and keep refining. The associations seeing the best results are the ones treating email as an ongoing conversation with their members—not a perfection contest.
For more on email strategy, explore the complete Association Email Marketing Guide or learn about segmentation strategies that improve engagement across all metrics.
Key takeaways
- Association emails typically outperform B2C: Expect 20-25% open rates vs. 15-18% for commercial email
- Open rates are less reliable now: Apple Mail Privacy Protection inflates open tracking—focus on clicks
- Click-to-open rate (CTOR) matters more: Measures content relevance independent of subject lines
- Trends matter more than absolutes: Your improvement over time is more important than hitting industry averages
Track Metrics That Matter
i4a's email platform provides detailed analytics for every campaign—opens, clicks, bounces, and conversions—all connected to your membership data.
Request a DemoRelated resources
Email Deliverability for Associations
Ensure your emails reach the inbox, not the spam folder.
Target the right members with the right messages at the right time.
Association Email Marketing Guide
Complete strategy guide for association email marketing success.
Integrated email tools built specifically for membership organizations.