Quick Summary: Association KPIs
- 15 metrics maximum: Track only the KPIs that genuinely predict success—more leads to analysis paralysis, fewer misses critical signals.
- Retention rate benchmark: Target 80-85% retention; below 75% signals a critical issue requiring immediate attention.
- Engagement predicts renewal: Composite engagement scores identify at-risk members 6+ months before they lapse, enabling proactive intervention.
- Financial diversification: Non-dues revenue should represent 40-60% of total revenue for long-term stability and resilience.
- LTV guides spending: Member Lifetime Value determines acquisition budgets—aim for an LTV:CAC ratio of at least 3:1.
Part of our guide to membership analytics
Association KPIs reveal whether your organization is healthy and headed in the right direction—but most associations measure the wrong things, too many things, or nothing consistently at all. These 15 metrics are what high-performing membership organizations actually track.
The stakes are high. Sequence Consulting's 2026 Association Trends Report found that 55% of associations are seeing flat or declining retention, while 40% lack a consistent member feedback loop. Without the right metrics, you're essentially flying blind—unable to identify issues until members have already disengaged or left.
After three decades working with associations, I've seen a consistent pattern: organizations with 85%+ retention and steady growth don't track dozens of data points. They focus relentlessly on a small set of vital indicators—typically 15 or fewer—that genuinely predict success.
Below are the 15 KPIs that distinguish thriving associations from those still wondering why members aren't sticking around.
Why KPIs matter for associations
Most associations are swimming in data but starving for insight, and that gap shows up first in retention and revenue. According to Sequence Consulting's 2026 Association Trends Report, more than half of associations are facing flat or declining retention while a significant share lack consistent member feedback loops—clear signs that decisions are being made without the right numbers front and center. When you focus on a small set of meaningful KPIs, you move from reacting to problems after members leave to anticipating issues early, prioritizing limited staff time, and confidently deciding where to invest next. The goal is not to track everything, but to track the few metrics that reliably answer, "Are we healthy, and what should we do now?"
A modern association management system with robust reporting dashboards should make tracking these metrics effortless—not require manual spreadsheet gymnastics.
Membership health KPIs
Membership health metrics are the heartbeat of your association, showing at a glance whether you're growing, holding steady, or slowly leaking members. Instead of looking only at total membership—an easy number to quote but a poor guide for decisions—these KPIs reveal what's really happening underneath: how many members stay, how many go, and what each relationship is worth over time. When you review them consistently, you can spot early warning signs, understand the impact of your recruitment and onboarding efforts, and make informed choices about where to focus your retention strategy. Think of this section as your monthly wellness check for the organization, not just a year-end report.
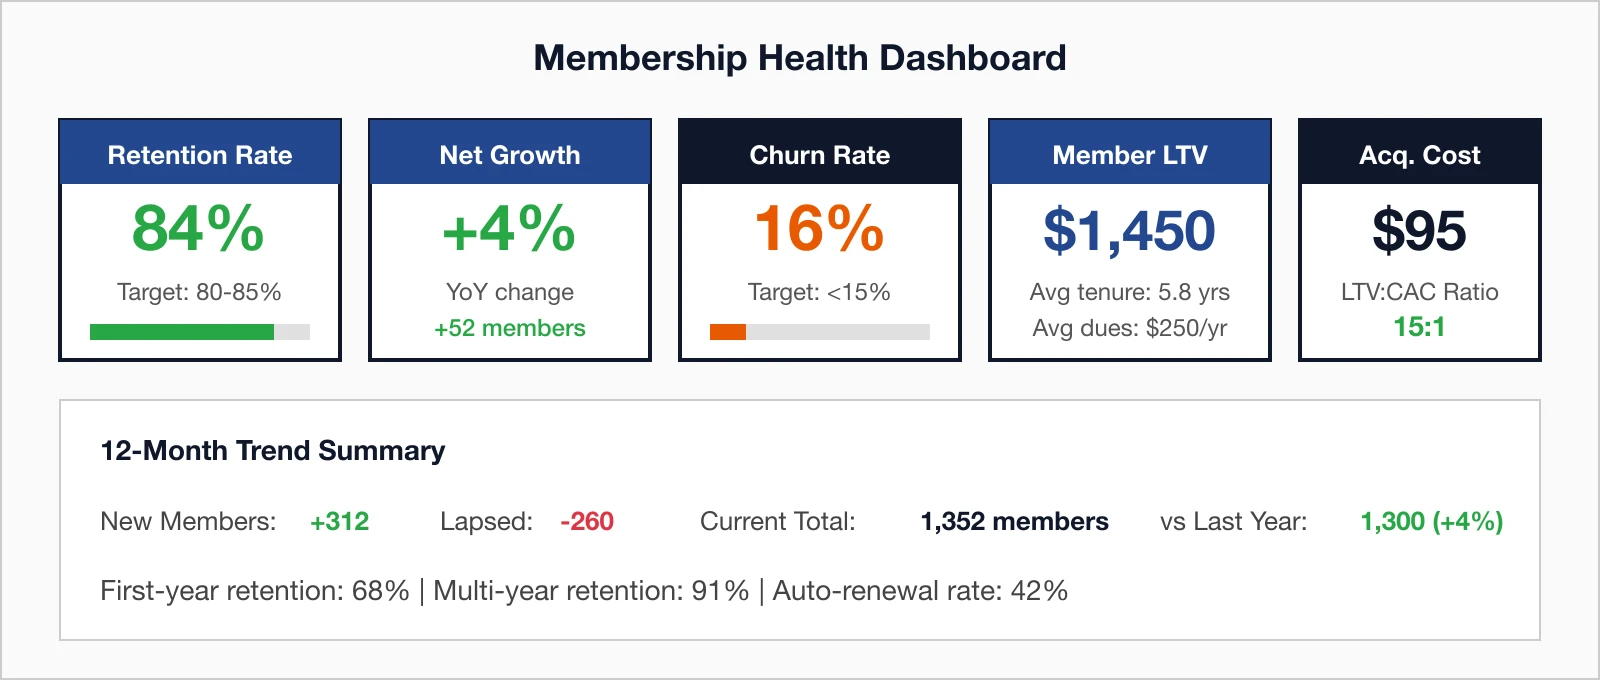
Retention rate
Retention rate measures the percentage of members who renew their membership when due. Retention is the foundation of sustainable growth—acquiring new members costs significantly more than retaining existing ones, and even modest retention improvements compound into major lifetime value gains.
| Retention Rate | Assessment | Action |
|---|---|---|
| 90%+ | Excellent | Focus on acquisition; retention is strong |
| 80-89% | Good | Continue current efforts; look for incremental gains |
| 70-79% | Needs Improvement | Prioritize engagement and value demonstration |
| <70% | Critical | Emergency focus on member experience and value |
Use our free Membership Retention Rate Calculator to measure your current retention, see how you compare to benchmarks, and model the revenue impact of improving by just a few percentage points.
Net member growth
Net member growth tracks the total change in membership over a period. Unlike total membership count, net growth shows whether you're actually moving forward—an association with 100 new members and 120 lapses is shrinking, even if it still looks large.
Churn rate
Churn rate measures the percentage of members who don't renew (the inverse of retention rate). Churn is where you're "leaking" members—understanding when and why members leave reveals fixable problems.
Member lifetime value (LTV)
Member lifetime value (LTV) calculates total revenue generated by an average member over their entire relationship. LTV tells you how much you can afford to spend on acquisition and retention—if LTV is $1,450, spending $300 to acquire a member makes sense. Spending $1,500 doesn't.
Member acquisition cost (CAC)
Member acquisition cost (CAC) measures the average cost to acquire one new member. Knowing your CAC prevents overspending on acquisition and helps allocate marketing budget effectively. Track CAC by channel to identify your most efficient acquisition sources.
Engagement KPIs
Engagement metrics function like an early-warning system, telling you which members are drifting away long before they show up as non-renewals. Industry benchmarking data shows more than half of lapsed members cite lack of engagement as a key reason they don't renew—yet many associations still rely on retention rate alone, which only moves after the damage is done. By tracking how members interact with events, emails, communities, and benefits, you can identify who is thriving, who is at risk, and where your programs are actually delivering value. These KPIs give you the visibility to intervene with at-risk members in time and to double down on the experiences that keep people coming back.
Engagement score
Engagement score is a composite score based on multiple engagement activities (events attended, emails opened, portal logins, etc.). Engagement score predicts renewal behavior 6+ months in advance—members with low scores approaching renewal are your highest-priority intervention targets.
Event participation rate
Event participation rate is the percentage of members who attend at least one event annually. Event attendees typically renew at significantly higher rates than non-attendees—if only a small fraction of members attend events, the rest are missing your highest-value touchpoint.
Email engagement rate
Email engagement rate tracks open rates and click-through rates on member communications. Email engagement is a proxy for overall interest—members who stop opening emails are often on the path to lapsing.
Portal/community login frequency
Portal/community login frequency measures how often members access your member portal or online community. Portal activity indicates members are actively using their benefits—zero logins over 6 months is a red flag.
Benefit utilization rate
Benefit utilization rate is the percentage of members using each available benefit. Benefits no one uses are wasted resources—benefits with high utilization among high-retention segments should be promoted to at-risk members.
Financial KPIs
Financial KPIs translate your membership strategy into dollars and sustainability, making it clear whether your current model can support the programs and staff your mission requires. It's not enough to know total revenue; associations need to understand how much value each member generates, how balanced dues and non-dues income are, and whether future revenue is predictable or precarious. By watching these metrics, you can spot over-reliance on a single stream, justify investments in new offerings, and weather downturns with fewer surprises. In practical terms, these KPIs help you answer the board's toughest questions: "Can we afford this?" and "What happens if retention changes?"
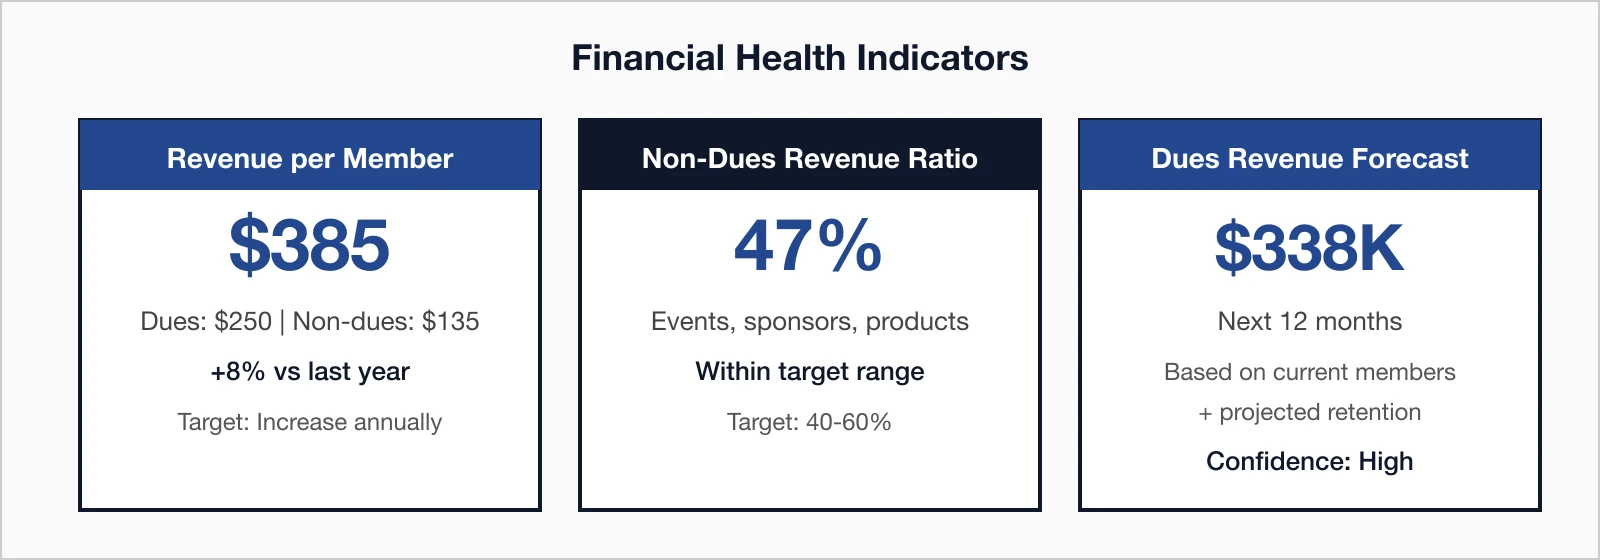
Revenue per member
Revenue per member is the average total revenue (dues + non-dues) generated per member. This reveals whether you're maximizing member value—if members pay $250 in dues but revenue per member is only $260, you're leaving money on the table with events, products, and sponsorships.
Non-dues revenue ratio
Non-dues revenue ratio is the percentage of total revenue from sources other than membership dues. Diversified revenue streams provide stability—if dues drop unexpectedly (economic downturn, competitive pressure), non-dues revenue keeps you afloat.
Dues revenue forecast
Dues revenue forecast is projected dues revenue based on current membership and expected retention. Forecasting lets you budget confidently—if you know ~84% of 1,352 members will renew at $250 average dues, you can project $284K in renewal revenue.
Operational KPIs
Operational KPIs shine a light on how efficiently your association delivers value once someone joins, which is often where retention is won or lost. New members may love your mission, but if it takes weeks to access benefits or days to get a support response, their enthusiasm fades fast. These metrics track how quickly members experience their first "win," how responsive your team is to questions, and whether everyday processes run smoothly enough to build trust rather than frustration. By tightening up these operational levers, you not only improve the member experience but also make staff workloads more manageable and predictable.
Time to value (new member)
Time to value measures how quickly new members engage with their first meaningful benefit. Members who don't engage early are far more likely to churn at first renewal—fast time-to-value sets the foundation for long-term retention.
Support response time
Support response time is the average time to respond to member inquiries and resolve issues. Support quality directly impacts member perception—members with negative support experiences are significantly more likely to lapse.
Building your KPI dashboard
A thoughtful KPI list is only useful if people can see, understand, and act on it, which is where dashboard design matters. Too many associations rely on sprawling spreadsheets or dense reports that no one reviews until just before a board meeting, if at all. A well-designed dashboard pulls your most important metrics into a single, easy-to-scan view, highlights trends rather than isolated numbers, and gives each audience—from the board to frontline staff—the specific insights they need. When your dashboards are clear and role-specific, they become everyday decision tools instead of static reports filed away after each meeting.
Dashboard design principles
- Lead with most important metrics (retention, growth)
- Show trends over time, not just current values
- Include targets/benchmarks for context
- Use consistent color coding (green=good, red=bad)
- Enable drill-down for investigation
- Keep it to one screen—no scrolling for key metrics
- Too many metrics (cognitive overload)
- Numbers without context or comparison
- Static reports instead of real-time data
- Same view for all audiences (board vs. staff)
- Vanity metrics that don't drive decisions
- Manual updates that become outdated
Role-based dashboards
Different stakeholders ask different questions of your data, so a one-size-fits-all dashboard rarely works in practice. Board members want a concise view of overall health and risk; executives need to see trends and forecasts; membership and marketing teams need operational detail they can act on this week. Role-based dashboards acknowledge these differences by tailoring the metrics, level of detail, and review cadence to each group. This approach keeps leadership aligned on the big picture while empowering staff with the granular insights they need to move the numbers in the right direction.
| Audience | Focus | Cadence |
|---|---|---|
| Board | High-level health: retention, growth, revenue, satisfaction | Quarterly |
| Executive Director | Strategic metrics: trends, forecasts, benchmarks | Monthly |
| Membership Staff | Operational: renewals due, at-risk members, new joins | Weekly/Daily |
| Marketing | Campaign performance: email, events, acquisition | Weekly |
A well-designed membership platform should make it easy to build and customize these dashboards without requiring external tools or heavy IT involvement.
Recommended tracking cadence
Even the best KPIs lose their power if they're reviewed too infrequently—or so often that changes are just noise. A clear tracking cadence ensures that each metric is updated often enough to catch issues early, but not so often that teams drown in reports without time to act. Daily or weekly views work well for operational and engagement KPIs that move quickly, while strategic indicators like LTV or annual retention can follow a monthly or quarterly rhythm. When everyone knows when metrics will be refreshed and discussed, you build a predictable habit of data-driven review rather than ad-hoc panic checks when something "feels off."
Common KPI mistakes to avoid
Most KPI problems come not from a lack of data, but from misusing or overwhelming it. Associations frequently fall into the trap of tracking dozens of numbers that look impressive but don't influence real decisions, or focusing only on lagging indicators that signal trouble after it's too late to respond. Another common issue is looking at averages that mask important differences between segments, such as first-year and long-tenured members. This section calls out those pitfalls so you can design a measurement approach that is focused, actionable, and aligned with how your team actually works.
Tracking too many metrics
If you're tracking 50 metrics, you're tracking none effectively. Limit your primary KPIs to 15 or fewer. Additional metrics can exist for deep dives, but they shouldn't be on your main dashboard.
Focusing on vanity metrics
"Total members ever" sounds impressive but doesn't tell you anything useful. Focus on actionable metrics that drive decisions.
Ignoring leading indicators
Retention rate is a lagging indicator—by the time it drops, members have already left. Engagement metrics are leading indicators that let you intervene before it's too late.
Not segmenting data
Overall retention of 82% might hide that first-year retention is 65% while multi-year retention is 92%. Segment by tenure, member type, and acquisition source.
No action framework
KPIs without action plans are just numbers. Define what you'll do when metrics hit certain thresholds:
- Engagement score drops below 25 → Trigger re-engagement campaign
- Retention drops below 80% → Convene retention task force
- CAC exceeds $150 → Review acquisition channels
Conclusion: From data to decisions
Data only becomes valuable when it shapes choices, priorities, and investments—not when it sits in a dashboard no one uses. The associations that consistently hit their retention and growth goals treat KPIs as part of their culture: they review them on a set cadence, talk about them in meetings, and tie actions directly to what the numbers show. By committing to a focused set of KPIs, tracking them reliably, and defining clear responses when they move, your organization can shift from reactive problem-solving to proactive, confident decision-making. The metrics are your map; the real impact comes from how you use them to navigate.
After 30 years of working with associations, I've seen the same pattern repeat: the organizations that grow aren't necessarily the ones with the most resources or the largest staff. They're the ones that know their numbers. They can tell you their first-year retention rate off the top of their head. They know which acquisition channels produce members who actually renew. They spot a dip in engagement scores before it becomes a retention crisis.
If you take one thing from this article, make it this: start small. Pick three KPIs from this list—retention rate, engagement score, and one financial metric—and commit to reviewing them monthly for the next quarter. You'll be surprised how quickly patterns emerge and how much more confident your decisions become when they're grounded in real data instead of hunches.
For a deeper dive into membership analytics, including engagement scoring, cohort analysis, and predictive modeling, see our Membership Analytics Guide.
Key takeaways
- Retention rate is your #1 KPI: Industry benchmark is 80-85%; below 75% signals serious problems
- Member Lifetime Value (LTV) should guide acquisition spending—aim for LTV:CAC ratio of 3:1
- Engagement score predicts renewal 6+ months in advance—track it proactively
- Non-dues revenue ratio should be 40-60% for financial sustainability
- Track 15 KPIs maximum—more leads to analysis paralysis, fewer misses critical signals
Track the KPIs That Matter
i4a's association management platform includes dashboard and reporting tools to help you track your most important metrics. See your membership health at a glance and drill into the details when you need them.
Talk to Us About AnalyticsRelated resources
Complete guide to membership analytics including engagement scoring, cohort analysis, and predictive modeling.
Data-driven strategies to improve retention rates and reduce member churn.
How to Use Member Data to Make Better Decisions
Turn membership data into actionable insights.
How to Reduce Membership Churn
10 proven strategies to improve retention.