Quick Summary: Association Board Reporting
- 10 metrics maximum: Focus on organizational health and strategic progress—membership, retention, revenue, engagement, and goal achievement.
- Lead with the summary: Most board members read only the first page; put critical information, action items, and concerns there.
- Every number needs context: Show comparisons vs. last year, vs. budget, and vs. benchmark—raw numbers alone are meaningless.
- Use traffic light indicators: Red/yellow/green status signals make trends instantly visible in the 8 seconds boards spend scanning.
- Strategic vs. operational test: Before adding anything, ask if the board needs it to govern or if it's operational detail staff should manage.
Part of our membership analytics resource library
Board reporting fails most associations the same way—too much data, not enough insight. Here's how to create reports that actually help your directors govern, with 10 essential metrics and templates that work.
A 50-page packet full of raw numbers doesn't help board members govern effectively. They don't have time to sift through spreadsheets. What they need is curated information that answers two key questions: How healthy is the organization? and What decisions require our attention?
The good news is, it doesn't have to be that way. With a few simple shifts, you can create board reports that move beyond data dumps and actually drive strategic decisions. This guide will show you how.

The board reporting challenge
Association boards face a unique governance challenge. Board members are typically volunteers—industry leaders with demanding day jobs. They receive board materials days before meetings and have limited time to digest complex information. This is especially true for trade associations with boards of company executives and membership nonprofits with diverse volunteer boards.
Yet the decisions they make shape the organization's future: strategic direction, financial health, executive leadership, and member value. And the stakes are high: Sequence Consulting's 2026 Association Trends Report found that 55% of associations are experiencing flat or declining retention—a metric that should be front and center in every board report.
What goes wrong
- Data overload: 50+ pages of reports with no clear hierarchy
- No context: Numbers without comparison or explanation
- Operational focus: Too much detail on day-to-day activities
- Missing trends: Point-in-time snapshots instead of directional movement
- Buried issues: Problems hidden in appendices instead of surfaced clearly
The test: If a board member can't understand your organization's health from the first page in 60 seconds, your reporting needs work.
What boards actually need (vs. what we give them)
Board members have governance responsibilities, not operational ones. Your reports should support what they actually need to do:
| Board Responsibility | What They Need to See | What NOT to Include |
|---|---|---|
| Financial Oversight | Budget vs. actual, cash position, financial trends | Every line item in the GL |
| Strategic Direction | Progress on strategic goals, KPI performance | Project task lists |
| Risk Management | Material risks, mitigation status | Minor operational issues |
| Membership Health | Retention, growth, engagement trends | Individual member details |
| Executive Performance | Key results delivered, challenges faced | Daily activity logs |
The strategic vs. operational test
Before adding anything to a board report, ask: "Does the board need to know this to govern, or is this operational information they're trusting staff to manage?"
If it's operational, leave it out. Make it available in appendices if board members want to dig deeper, but don't clutter the main report.

10 essential board metrics
Every board needs clear, consistent metrics to understand the organization's health at a glance. These numbers tell the story of progress, risk, and sustainability—without overwhelming directors with operational details.
Here are 10 core metrics every association board should review regularly. They provide a balanced picture of financial stability, member engagement, and long-term growth, helping the board focus on what truly matters: strategic direction and organizational impact.
Context for each metric
A number alone is useless. For every metric, include:
- Current value: Where we are now
- Comparison: vs. last year, last quarter, and budget/goal
- Trend: Direction of movement (improving, declining, stable)
- Status indicator: Red/yellow/green visual
- Brief explanation: 1-2 sentences on why if there's significant variance
Board report structure template
Here's a proven structure that keeps board reports focused and actionable:

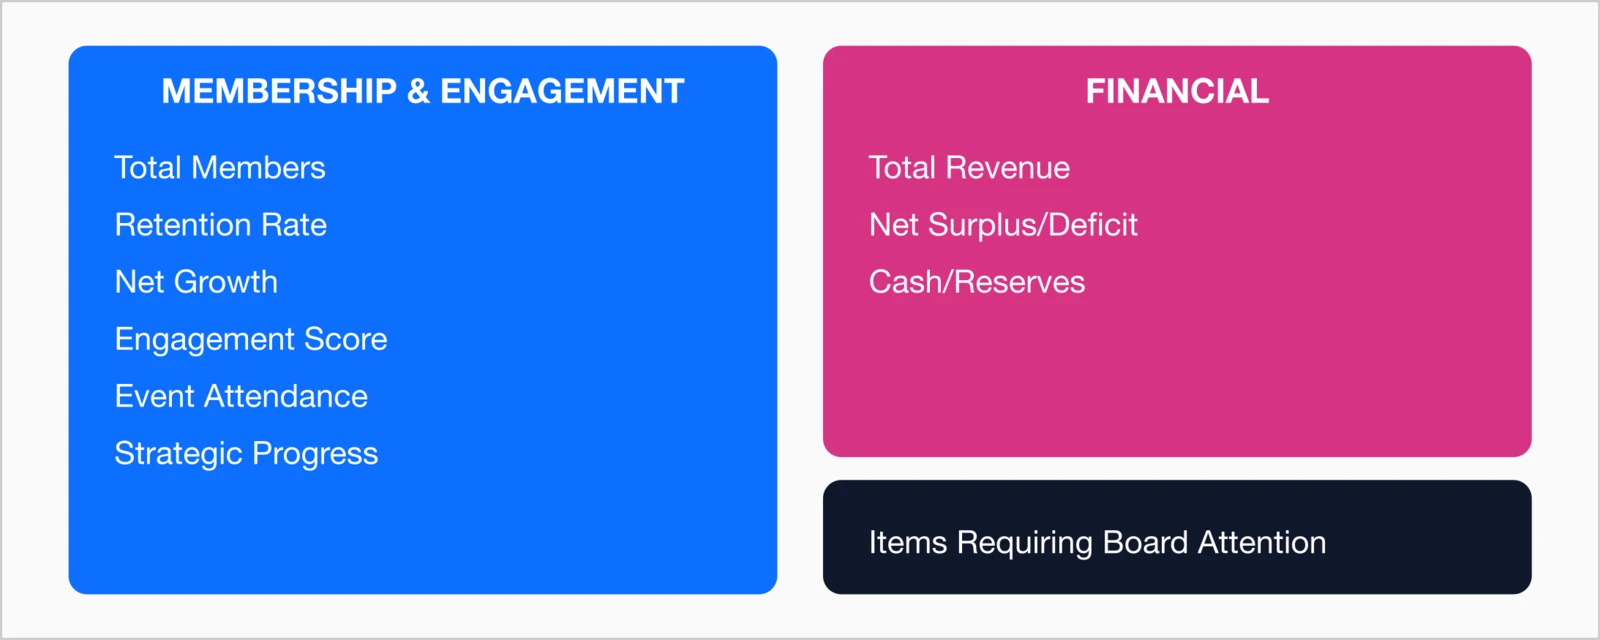
Page 1: Executive summary (the only page many will read)
- Organizational health snapshot: Key metrics with traffic light indicators
- Items requiring board action: What decisions are needed today?
- Key wins since last meeting: 2-3 major accomplishments
- Key concerns: 2-3 things keeping you up at night
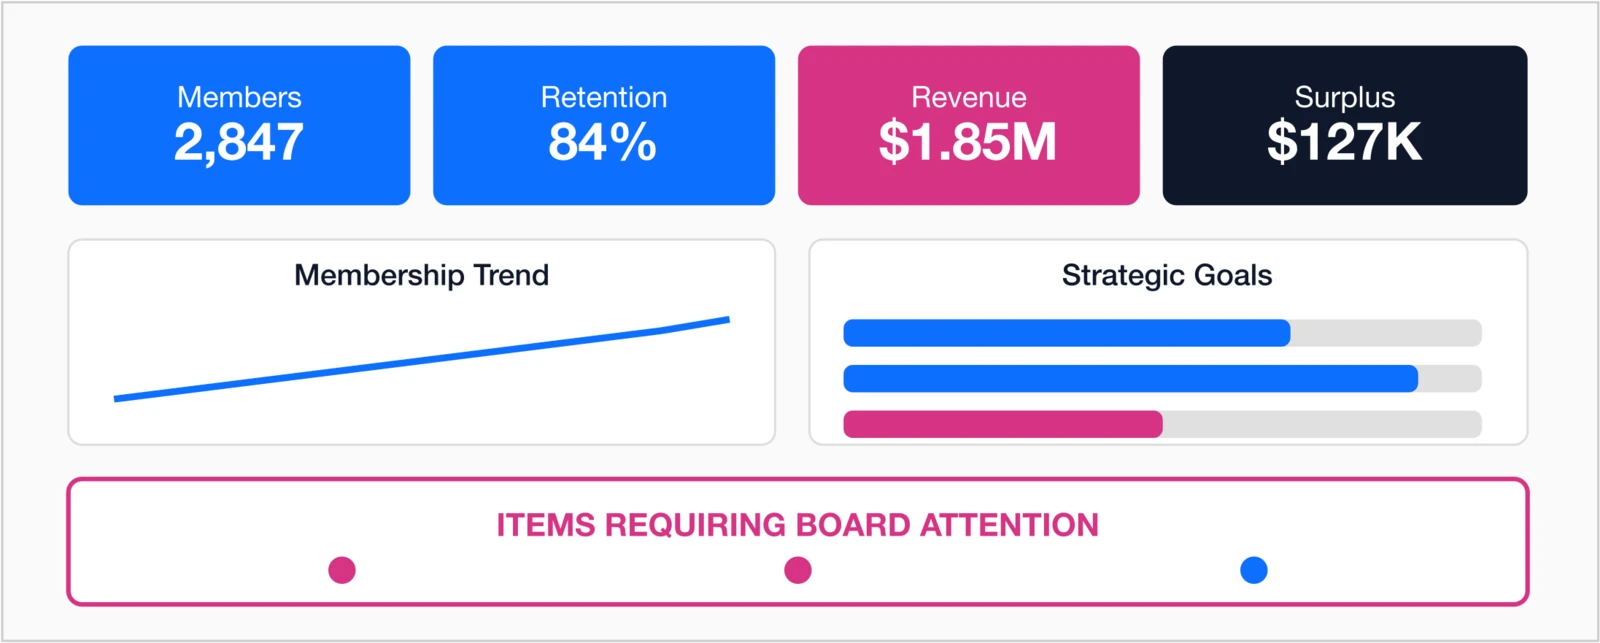
Pages 2-3: Dashboard visualizations
- Membership trend (12-month chart)
- Financial position (revenue vs. budget)
- Strategic goal progress bars
- Engagement indicators
Pages 4-5: Narrative summary
- Membership report: New members, retention, notable changes
- Financial report: Budget variance explanations
- Program highlights: Events, education, advocacy updates
- Strategic initiatives: Progress on annual goals
Appendices (for those who want to dig deeper)
- Detailed financial statements
- Committee reports
- Project status details
- Supporting data
The 5-5-5 rule: Board members should understand your organization's health in 5 seconds (page 1 headline), 5 minutes (executive summary), or 50 minutes (full report + appendices). Support all three timeframes.
Board dashboard design
The visual dashboard is often the most valuable part of a board report. Here's how to design one that works:
Dashboard design principles for boards
- Status at a glance: Red/yellow/green indicators visible immediately
- Big numbers for key metrics: 3-4 most important metrics in large font
- Trends over snapshots: Charts showing direction, not just current state
- Strategic alignment: Progress against strategic goals visible
- Action items highlighted: What needs board attention stands out
For more on dashboard design, see our guide on How to Design a Membership Dashboard That Drives Action.
7 board reporting mistakes to avoid
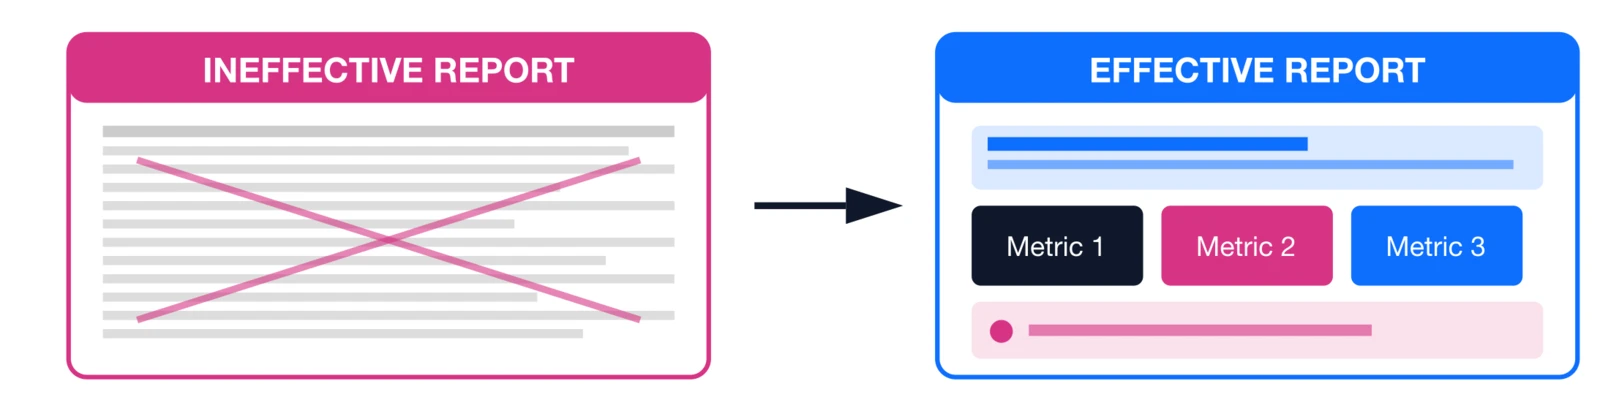
- The Data Dump — Sending 50 pages of raw data without synthesis. Board members don't have time to analyze; that's your job.
Fix: Lead with conclusions. Put supporting data in appendices.
- No Comparisons — "$1.2M in revenue" means nothing without context.
Fix: Always show vs. budget, vs. last year, and vs. goal.
- Hiding Bad News — Burying problems on page 47 or spinning negative trends.
Fix: Surface issues prominently with your planned response. Boards respect transparency.
- Only Backward-Looking — Reports only show what happened, not what's coming.
Fix: Include forward indicators: renewal pipeline, at-risk members, projected year-end.
- Too Operational — Reporting on every project and task instead of strategic progress.
Fix: Focus on outcomes and strategic goals, not activities.
- Inconsistent Format — Reports look different every time; board members waste time figuring out the format.
Fix: Use a consistent template. Same structure, same metrics, same location every meeting.
- No Explanation of Variances — Showing that revenue is 10% below budget without explaining why.
Fix: Every significant variance needs a 1-2 sentence explanation and (if negative) a response plan.
Reporting frequency: What to share when

| Timeframe | What to Report | Format |
|---|---|---|
| Board Meetings (Quarterly or as scheduled) | Full board report with all 10 metrics, strategic progress, action items | Formal report + dashboard |
| Monthly Updates (Between meetings) | 5-minute email: Key metrics snapshot, any urgent developments | Brief email with 5 bullet points |
| Real-Time Access | Self-service dashboard for board members who want current data | Online dashboard login |
| Annual Report | Year-in-review: accomplishments, financials, strategic progress | Comprehensive document |
Pro tip: Some boards appreciate a monthly "no news" email confirming everything is on track. It builds confidence that you're monitoring and will surface issues if they arise.
Getting board buy-in on new reporting
Changing board reports requires board support. Here's how to get it:

- Start with the Problem — "Our current board reports don't help you govern effectively. Here's what I propose instead."
- Pilot with a Board Champion — Find one board member who shares your vision. Get their input on the new format before presenting to the full board.
- Show a Sample — Don't describe the new format; show it. A mock-up is worth 1,000 explanations.
- Commit to Consistency — Promise that the new format will be consistent meeting-to-meeting. Board members will appreciate not having to re-learn the report each time.
- Get Feedback Early — After the first meeting with new reports, ask: "What's working? What's missing?" Iterate based on board input.
How i4a supports board reporting
i4a's reporting platform makes board reporting easier:
- Executive Dashboards: Pre-built membership and revenue dashboards showing retention, renewal trends, dues income, and other key metrics
- Automated Reports: Schedule reports to generate before each board meeting
- Real-Time Data: Board members can access current metrics anytime
- Trend Charts: 12-month trend visualizations built in
Key takeaways
- 10 metrics max: Board reports should include no more than 10 key metrics—focus on organizational health and strategic progress
- Lead with a one-page summary: Most board members won't read past page 2; put critical information first
- Always show comparisons: Every metric needs context (vs. last year, vs. budget, vs. benchmark)
- Traffic light indicators: Red/yellow/green status makes trends instantly visible
- Exception reporting: Highlight what needs attention; don't bury problems in pages of data
- Strategic alignment: Every metric should connect to a strategic goal
Simplify Your Board Reporting
See how i4a's association management software gives you the real-time membership and revenue data you need for effective board reporting.
Request a DemoRelated resources
Complete Guide to Membership Analytics
Master all aspects of membership measurement and reporting.
Explore i4a's reporting and analytics capabilities.
How to Design a Membership Dashboard
Dashboard design principles that apply to board reporting.
15 KPIs Every Association Should Track
The metrics that matter most for board oversight.