Quick Summary: Data-Driven Membership Decisions
- Track 5 core metrics: Growth rate, retention rate, churn rate, member lifetime value, and acquisition cost form the foundation of data-driven management.
- Spot at-risk members early: Declining engagement signals—fewer logins, event skips, email disengagement—predict non-renewal before it happens.
- Segment for relevance: Personalized communication by tenure, geography, or engagement level dramatically improves response rates.
- Benchmark against industry: Median renewal is 84% overall but just 75% for first-year members—know where you stand.
- Build analytics into culture: Regular reporting, dashboard access, and evidence-based decisions should be standard operating procedure.
Part of our complete membership analytics guide
Data-driven membership decisions replace gut instinct with evidence—helping you spot at-risk members, segment for better engagement, and prove ROI to your board. Here's how to track the metrics that actually matter.
The most effective associations turn data into actionable insights that guide decisions on engagement, retention, revenue, and growth. Industry research shows 70% of associations still struggle to integrate engagement tools effectively—making it difficult to get a unified view of member data. The good news? With the right focus and tools, you can use analytics to build stronger, longer-lasting member relationships.
Track the right metrics
Not all data is equally valuable. Focusing on a few core metrics helps you monitor organizational health and measure what truly drives results:

5 core membership metrics
- Growth Rate: Month-over-month new member acquisition
- Retention Rate: Percentage of members who renew annually
- Churn Rate: Percentage of members who don't renew
- Lifetime Value: Total revenue generated per member over their lifetime
- Acquisition Cost: Average cost to acquire each new member
Track these monthly to maintain a clear view of your organization's momentum.
Engagement metrics
- Event Attendance: Measure participation in meetings, webinars, and conferences
- Email Engagement: Track open, click-through, and unsubscribe rates
- Portal Usage: Evaluate login frequency and feature utilization
- Community Activity: Monitor forum posts, comments, and discussions
- Resource Downloads: Identify which content delivers the most value
Financial metrics
- Total Revenue: Breakdown by dues, events, sponsorships, and other sources
- Revenue Per Member: Average income generated per member
- Non-Dues Revenue: Additional income from programs beyond membership fees
- Payment Timing: When members typically renew and pay
A well-designed reporting and analytics dashboard makes it easy to track these metrics in real time and spot trends before they become problems.
Identify at-risk members before they leave
Data can help you see disengagement long before a member fails to renew. According to MGI's 2025 Membership Marketing Benchmarking Report, 52% of non-renewing members cite "lack of engagement" as their top reason for leaving. That means behavioral patterns in your data often reveal churn risk early.
Warning signs to watch
- Fewer event registrations
- Declining email engagement
- Decreased portal logins
- No resource downloads or benefit use
- Late or irregular renewals
- Negative feedback or complaints
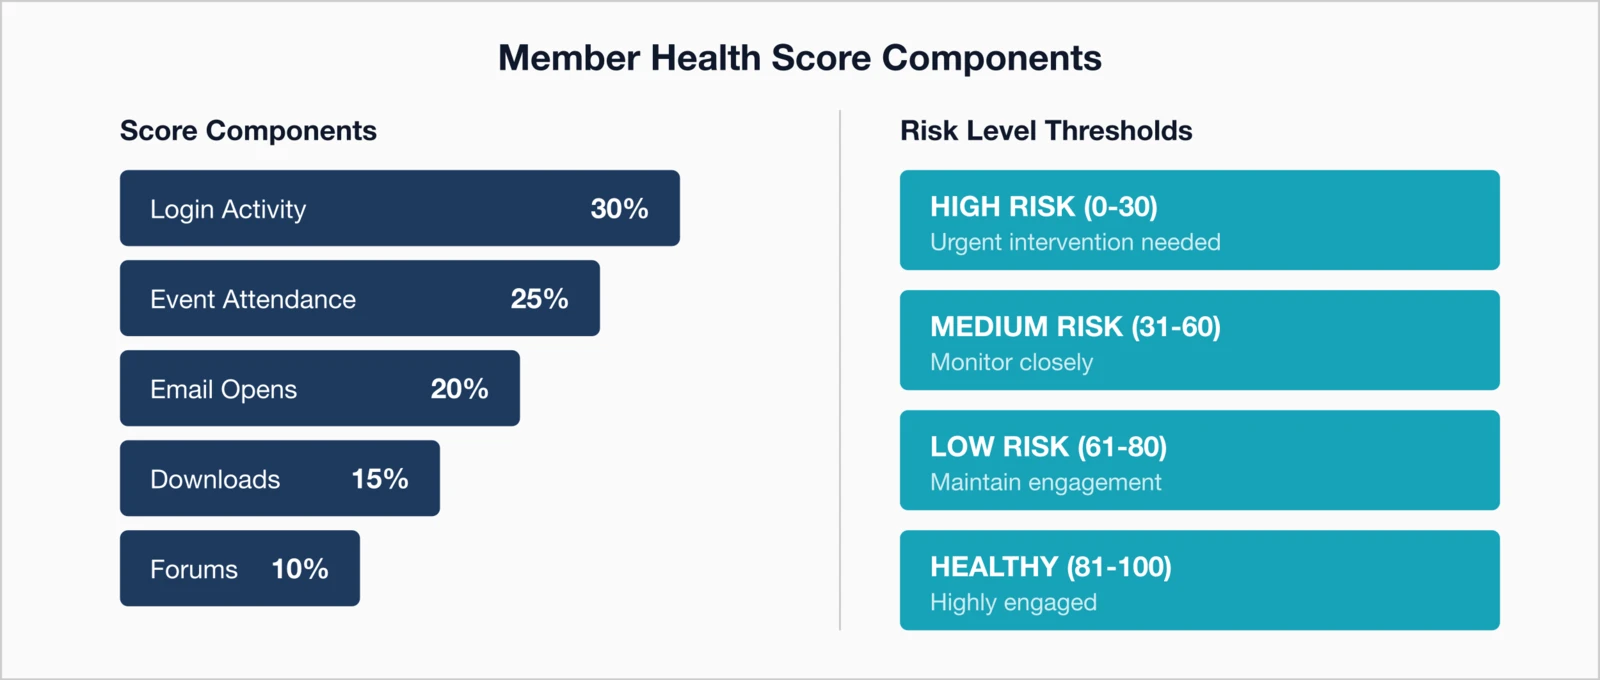
Pro Tip: Create a "member health score" that combines multiple engagement metrics. Members below a certain threshold get targeted outreach before their renewal date.
Intervention strategies
Act as soon as warning signs appear:
- Send personal outreach from staff or board members
- Survey members to uncover needs or challenges
- Offer incentives to encourage renewal or reengagement
- Highlight underused membership benefits
- Connect disengaged members with peer mentors
A comprehensive membership management system can automate much of this by flagging at-risk members for early action.
Segment your membership for targeted communication
One-size-fits-all messaging no longer works. Segmentation helps you personalize communications and deliver more meaningful experiences.
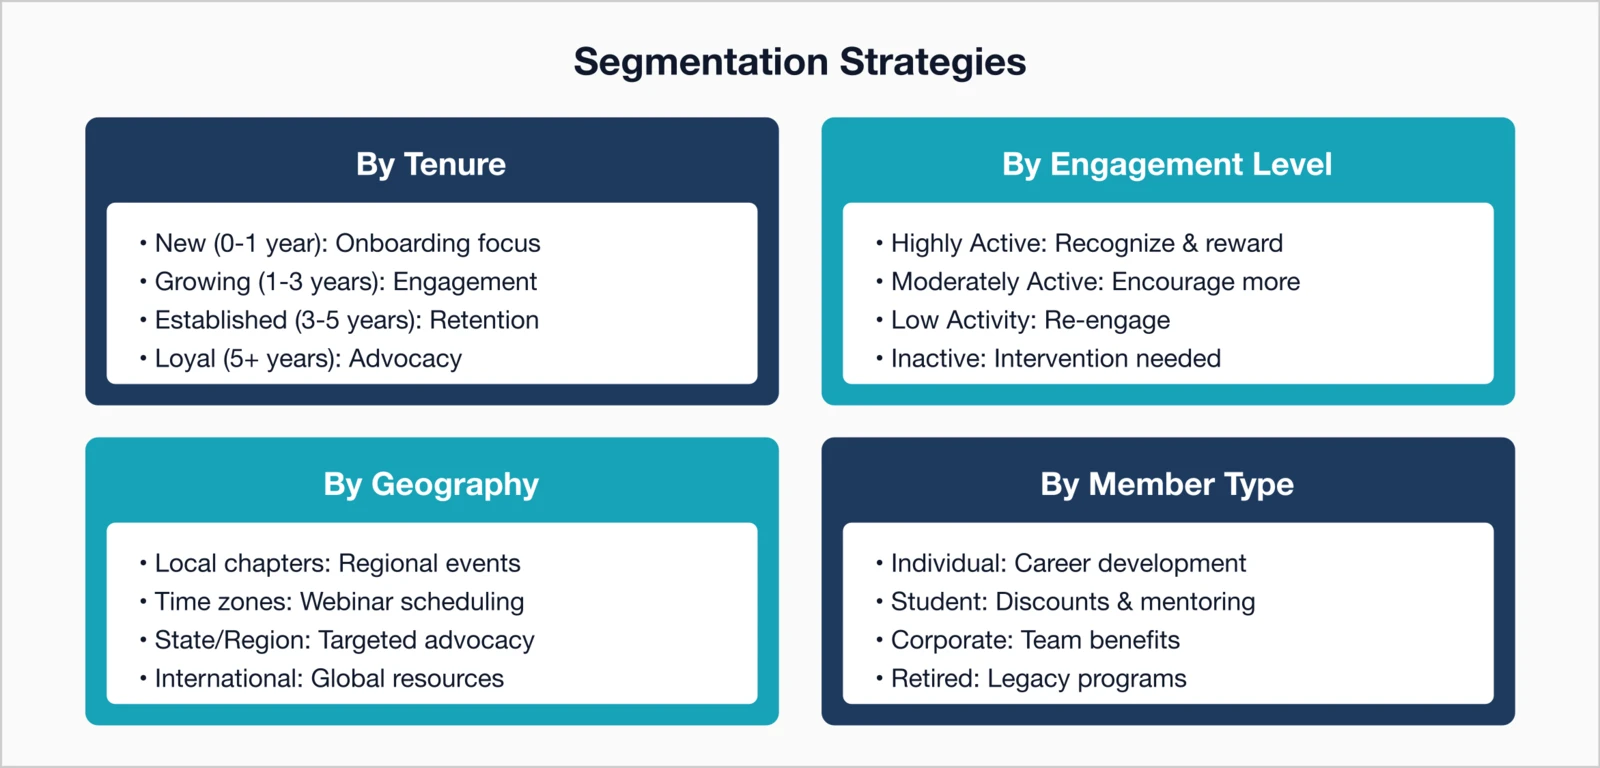
Common segmentation strategies
- Membership Type: Individual, corporate, student, or retired
- Industry/Specialty: Professional focus or subject area
- Geography: Region, state, or local chapter
- Tenure: New vs. long-time members
- Engagement Level: Highly active vs. inactive
- Purchase History: Events or products purchased
- Demographics: Career stage, organization size, or role
Personalization in action
Use segments to deliver relevant, timely content:
- Customize event invitations by region
- Highlight industry-specific resources
- Offer students discounts or mentoring opportunities
- Recognize member milestones (5-year, 10-year, etc.)
- Recommend content based on past engagement
Personalized communication improves engagement and builds stronger loyalty over time.
Optimize event planning with historical data
Past event performance provides a wealth of insight to improve future planning.
Key data points
- Registration Patterns: When members sign up (early vs. last-minute)
- Attendance Rates: Percentage of registrants who attend
- Session Popularity: Topics and formats with highest turnout
- Pricing Sensitivity: How different price points affect registration
- Demographic Insights: Who prefers virtual vs. in-person events
- Geographic Trends: Top regions for hosting or marketing
Turning data into action
- Schedule events during historically strong periods
- Prioritize popular topics and speakers
- Adjust pricing for optimal registration
- Target promotions to those who attended similar events
- Optimize capacity based on attendance ratios
Measure email campaign effectiveness
Email remains one of the most powerful channels for member communication—if you track and act on performance data.
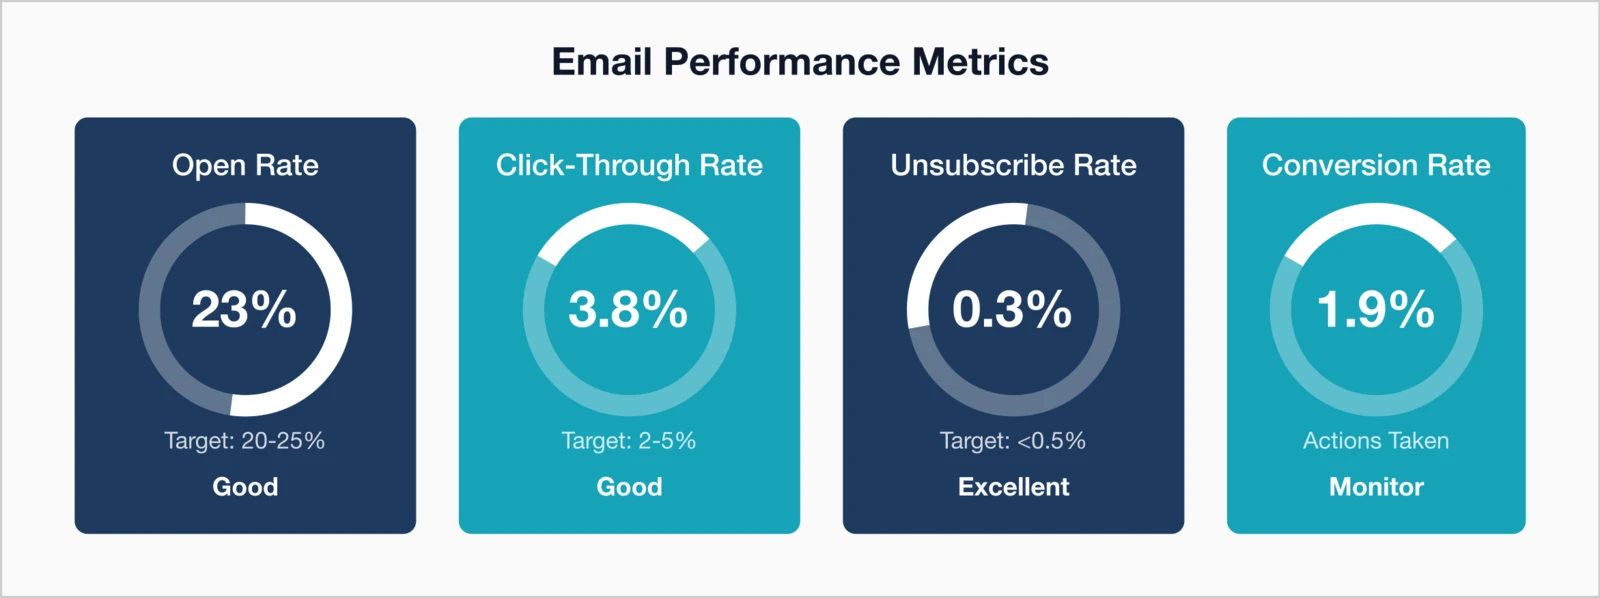
Key email metrics
- Open Rate: Percentage of recipients who open your emails
- Click-Through Rate: Percentage who click links within the email
- Unsubscribe Rate: How many opt out after each send
- Bounce Rate: Emails that fail to deliver
- Conversion Rate: Actions taken (registrations, purchases, etc.)
Boost results with testing
- A/B test subject lines to improve opens
- Experiment with send times and formats
- Shorten or personalize content for relevance
- Refine calls-to-action for higher conversion
- Segment lists for greater relevance
An integrated email marketing platform lets you monitor all these metrics and continuously refine your approach.
Use benchmarking to set realistic goals
Your numbers mean more when compared to industry standards. The 2025 Membership Marketing Benchmarking Report from Marketing General Inc. offers valuable context to measure success.
2025 industry benchmarks
- Overall Renewal Rate: 84% median
- First-Year Renewal Rate: 75% (a critical nine-point gap)
- Membership Growth: 45% of associations reported increases
- Top Non-Renewal Reason: Lack of engagement (52%)
Other key metrics
- Engagement Rate: Participation across all channels
- Non-Dues Revenue: Income from events and sponsorships
- Event Attendance: Percentage of total membership
Compare your data to these benchmarks to pinpoint where you're strong—and where there's room to grow.
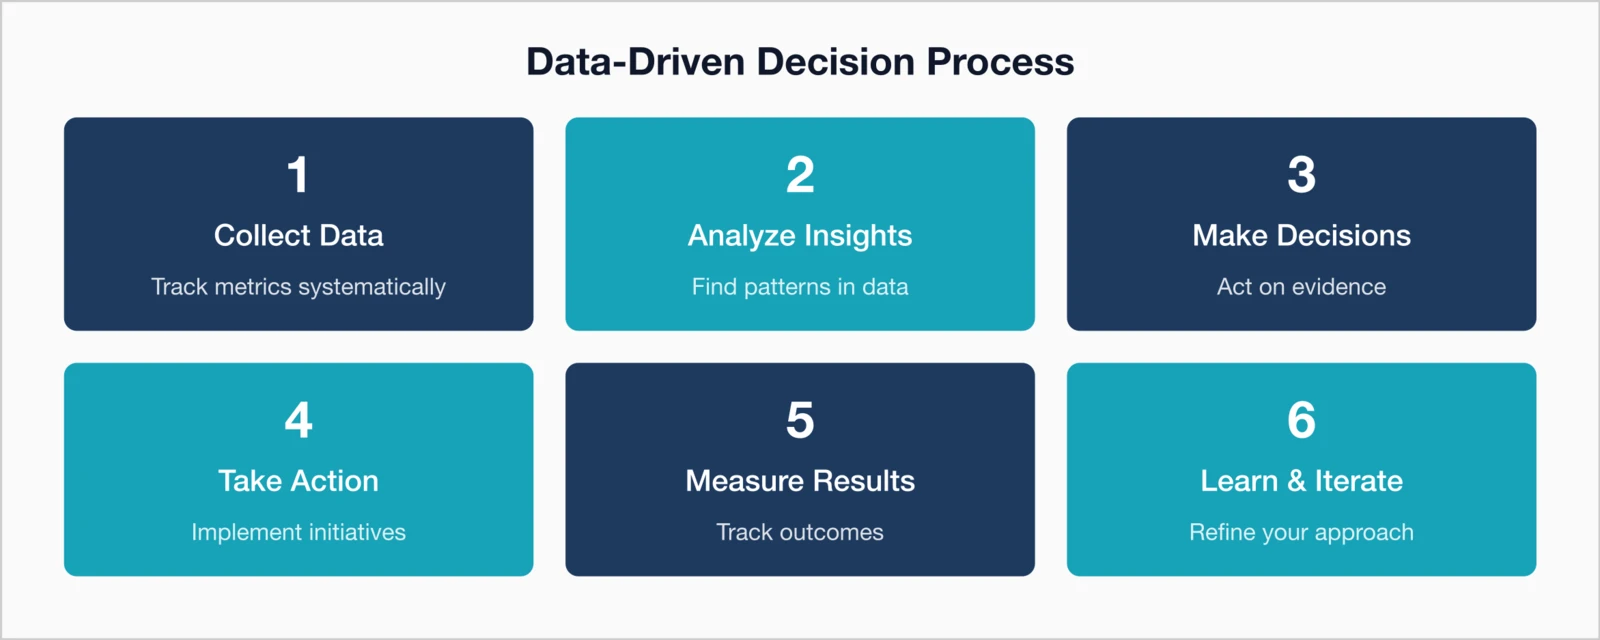
Build a data-driven culture
Sustainable success requires more than collecting data—it takes a culture that consistently applies it.
Best practices
- Regular Reporting: Review key metrics monthly or quarterly
- Dashboard Access: Give teams visibility for transparency
- Data Training: Offer training to interpret and use data
- Goal Setting: Set measurable, data-based goals
- Decision Framework: Require data support for strategic decisions
- Continuous Improvement: Embrace testing and iteration
How i4a helps you leverage data
i4a's membership management platform brings together analytics, automation, and reporting—all in one system:
- Advanced Dashboards: Real-time insight into engagement and revenue
- Custom Reports: Flexible options tailored to your goals
- Automated Insights: Scheduled reports delivered to your inbox
- Segmentation Tools: Target communications effortlessly
- Export Options: Easy data exports to Excel
- Historical Tracking: Compare performance year over year
And with unlimited members and contacts, you can scale your analytics without limits or added fees.
Key takeaways
- Track 5 essential metrics: Growth rate, retention, churn, lifetime value, and acquisition cost
- Identify at-risk members early: Use engagement indicators to spot warning signs before renewal
- Segmentation improves engagement: Personalize communication by tenure, interests, or geography
- Let historical data guide planning: Optimize events and campaigns based on past performance
- Compare against benchmarks: Industry data provides context for your results
- Build a data-driven culture: Make evidence-based decisions part of everyday operations
See Your Data Come to Life
Discover how i4a's membership platform reporting and analytics can help you make smarter, data-driven membership decisions.
Talk to Us About AnalyticsRelated resources
How to Reduce Membership Churn
Use data insights to reduce churn and retain members.
How to spot members likely to lapse.
What Features to Look for in Membership Software
Reporting capabilities should be a top priority.
Collect actionable feedback from members.