Quick Summary: Association Financial Reporting
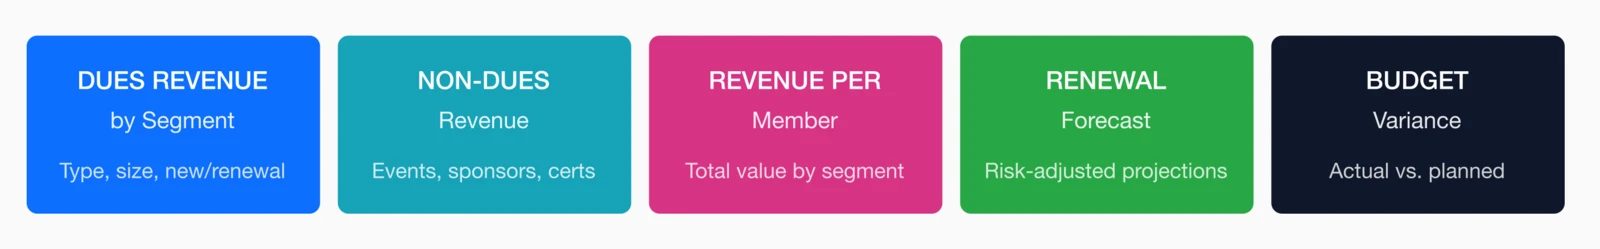
- Five essential reports: Dues by segment, non-dues revenue sources, revenue per member (LTV), renewal forecast, and budget variance analysis.
- Segment dues revenue: Break down by membership type, tenure, and geography to reveal which groups drive value and which need intervention.
- Diversify beyond dues: Strong non-dues revenue from events, education, and sponsorships provides stability when retention fluctuates.
- Track LTV:CAC ratio: Aim for 3:1 to 5:1—below 3:1 means acquisition costs are unsustainable, above 5:1 suggests underinvestment in growth.
- Forecast with engagement data: Probability-weighted projections based on member engagement are more accurate than simple flat-rate assumptions.
Part of our comprehensive analytics guide
Association financial reporting requires five essential reports: dues by segment, non-dues revenue, revenue per member, renewal forecast, and budget variance. Here's how to build each one—with formulas and examples.
Your AMS may show 2,500 members. Your accounting system shows dues revenue. But neither reveals which members generate the most income, how much revenue is at risk, or what it actually costs to serve each segment.
This disconnect between membership and financial data leaves money on the table. Industry benchmarking data shows the median renewal rate stands at 84%, while first-year renewals drop to just 75%. Closing that gap starts with smarter financial visibility. Meanwhile, Sequence Consulting's 2026 Association Trends Report notes that only 29.7% of associations successfully integrate their engagement and financial tools—leaving the rest to operate without a clear picture of member economics.
Having started my career as a CPA working exclusively with associations, I've seen this pattern play out for nearly 40 years: the organizations that thrive financially aren't necessarily the largest or the best-funded. They're the ones that understand their numbers at a granular level—which member segments drive the most value, where the risks are hiding, and how membership activity connects to the bottom line.
Why association financial reporting is different
Association finances look nothing like traditional business accounting. Understanding those differences helps create reports that reveal what actually drives sustainability and growth.
- Recurring revenue: Predictable income depends on consistent retention
- Deferred revenue: Dues paid in advance add accounting complexity
- Multiple revenue streams: Dues, events, sponsorships, publications, and certifications each require tracking
- Member economics: Revenue per member matters more than top-line totals
- Nonprofit structure: Surpluses are reinvested, not distributed
Standard reports can't capture these nuances. Association-specific financial reporting connects member behavior directly to revenue outcomes—a necessity for membership nonprofits with compliance requirements and AMCs managing multiple client associations.
The goal: Your reports should answer: "What happens to revenue if retention drops 5%?" and "Which member segments create the most long-term value?"
The 5 essential financial reports
Every association should build these five reports to clearly link membership activity and financial performance.
Revenue metrics to track
Before you create reports, make sure your system tracks these foundational metrics.
Primary revenue metrics
| Metric | Formula | Benchmark |
|---|---|---|
| Total Dues Revenue | Sum of all membership dues collected | Varies by org size |
| Non-Dues Revenue Ratio | Non-Dues ÷ Total Revenue × 100 |
Varies; higher = more diversified |
| Revenue Per Member | Total Revenue ÷ Total Members |
Varies widely by association type |
| Dues Revenue Growth Rate | (This Year − Last Year) ÷ Last Year × 100 |
Track trend over time |
| Revenue At Risk | Dues from members with low renewal probability | Monitor monthly |
Revenue health indicators
Look for the story behind the numbers:
- Dues concentration: How dependent are you on your top 10% of members?
- Revenue stability: What share of your income is recurring vs. one-time?
- Growth composition: Is growth driven by new members, higher prices, or diversification?
Report 1: Dues revenue
Dues are your most predictable—and most retention-sensitive—revenue stream. To protect and grow them, you need segmentation, not just totals.
Segment your dues revenue
| Segment | Why It Matters | What to Watch |
|---|---|---|
| Membership Type | Different types have different economics | Growth/decline by type |
| New vs. Renewal | Acquisition vs. retention performance | Ratio shifts over time |
| Company Size Tier | Tiered pricing revenue distribution | Migration between tiers |
| Geographic Region | Regional strength/weakness | Growth patterns by area |
| Join Year Cohort | Lifetime value patterns | Cohort revenue over time |

Insight: When a segment shows declining retention and revenue—like Small Business in this example—it's an early warning sign that needs intervention.
Report 2: Non-dues revenue
Associations overly dependent on dues risk instability during downturns. Non-dues revenue provides diversification and protection.
Common revenue sources
| Source | Typical % of Non-Dues | Growth Potential |
|---|---|---|
| Events & Conferences | Often the largest source | Moderate (capacity limits) |
| Education & Certification | Significant for many | High (scalable online) |
| Sponsorships & Advertising | Varies by industry | Moderate (market dependent) |
| Publications & Resources | Declining for most | Low (declining print) |
| Affinity Programs | Smaller but growing | Moderate |
Evaluating your non-dues revenue mix
- Heavily dues-dependent: If most revenue comes from dues, diversification reduces risk
- Balanced mix: Multiple meaningful revenue streams provide stability
- Well-diversified: Strong non-dues revenue indicates engaged members and market relevance
- Mostly non-dues: May indicate membership program is undervalued or underpriced
Track non-dues by participation
To go deeper, track non-dues revenue by participation—how many members buy beyond their dues, the average spend, and which groups are most engaged:
- What percentage of members purchase beyond dues?
- What's the average non-dues spend per participating member?
- Which member segments have the highest non-dues engagement?
Report 3: Revenue per member
Financial sustainability depends on understanding what each member is worth and what it costs to acquire them.
Lifetime value (LTV)
How much total revenue does an average member generate over their membership lifetime?
LTV = Average Annual Revenue × Average Membership Length
Example: $450/year × 4.2 years = $1,890 LTV
Acquisition cost (CAC)
What does it cost to acquire a new member?
CAC = Marketing & Sales Cost ÷ New Members Acquired
Example: $75,000 ÷ 250 = $300 CAC
Ltv:cac ratio
This ratio tells you if your acquisition spending is sustainable:
- Below 3:1: Acquisition cost too high
- 3:1 to 5:1: Healthy, sustainable range
- Above 5:1: Potential underinvestment in growth
First-year revenue vs. CAC
When first-year revenue covers CAC, you're profitable from day one. If not, you need that member to renew to break even.
Here's why this matters: I've watched associations pour resources into acquisition campaigns without understanding the payback period. Some spend $400 to acquire a member who pays $200 in year one. That's not a problem—if you retain them. But if first-year retention is weak, you're funding a revolving door. Knowing your LTV:CAC ratio helps you make smarter decisions about where to invest.
For complete insight, track these metrics alongside your key performance indicators (KPIs).
Report 4: Renewal forecast
Many associations forecast revenue using simple averages—an approach that overlooks renewal likelihood. A smarter path is probability-weighted forecasting using engagement data.
The problem with flat-rate forecasting
Traditional approach: "We have 1,000 members up for renewal at $300 each. Last year we retained 82%. So we forecast $246,000 in renewal revenue."
The problem: Not all members have equal renewal probability. Some are highly engaged and likely to renew. Others haven't logged in for months and are at high risk of lapsing.
Probability-weighted forecasting
A better approach: Assign renewal probability scores based on engagement data, then calculate expected revenue.
| Segment | Members Due | Avg Dues | Renewal Prob. | Expected Revenue |
|---|---|---|---|---|
| Highly Engaged | 300 | $300 | 92% | $82,800 |
| Moderate Engagement | 450 | $300 | 78% | $105,300 |
| Low Engagement | 200 | $300 | 55% | $33,000 |
| At Risk | 50 | $300 | 30% | $4,500 |
| Total | 1,000 | - | - | $225,600 |
By weighting renewals by likelihood, you forecast $225,600 instead of $246,000—a more accurate figure and a roadmap for action.
Action insight: Converting just 25 "At Risk" members to "Low Engagement" through targeted outreach adds roughly $3,750 in expected revenue. The forecast becomes a planning tool.
Report 5: Budget variance
A budget variance report compares actual revenue and expenses against your plan—showing where you're ahead, behind, or off-track.
What to include
- Revenue by line: Dues, events, sponsorships, certifications, and other sources
- Actual vs. budget: Both monthly and year-to-date
- Variance amount and percentage: How far off are you?
- Explanation notes: Document the "why" behind significant variances
Common variance causes
- Timing differences: Revenue recognized earlier or later than planned
- Volume changes: Higher or lower registrations, renewals, or purchases
- Price changes: Discounts, rate adjustments, or pricing tiers
- One-time items: Unexpected grants, refunds, or cancellations
Review budget variance monthly to catch issues early. Waiting for quarterly reviews often means problems compound before you can respond.
Financial reporting best practices
These proven practices turn raw financial data into clear, actionable insights—helping you spot trends early, explain performance gaps, and communicate results effectively to boards, teams, and stakeholders.
Integrate systems
Connect your AMS and accounting software. Manual reconciliation hides insights and wastes time.
Report monthly
Identify trends early with monthly reporting, not quarterly reviews that catch problems too late.
Show comparisons
Every metric should show position vs.:
- Budget
- Last year (same period)
- Previous month
Explain variances
Always document the "why" behind variances: timing issues, one-off events, or emerging trends that need attention.
Track leading and lagging indicators
Engagement predicts renewals; renewals confirm results. Track both to see the full picture.
Tailor dashboards
Build audience-specific dashboards. Board, membership, and events teams need distinct views.
One final thought: the goal isn't perfect data—it's better decisions. Start with the reports that matter most to your organization right now. For many associations, that's dues revenue by segment and a simple renewal forecast. Build from there. The organizations that succeed don't try to measure everything at once. They focus on a few key metrics, get comfortable with the data, and expand over time.
Key takeaways
- Five core reports: Dues by segment, non-dues sources, revenue per member, renewal forecast, and budget variance
- Diversification strengthens resilience: Non-dues income buffers against retention drops and economic shifts
- Segmentation drives insight: Granular data reveals trends hidden in totals
- Forecast smarter: Engagement-based projections improve accuracy and enable strategic action
- Measure acquisition ROI: Tracking CAC and first-year revenue protects long-term sustainability
See Your Financial Data Clearly
i4a includes membership and revenue dashboards, plus the ability to create custom reports from your data. Learn more or request a demo.
Request a DemoRelated resources
15 KPIs Every Association Should Track
Financial metrics alongside engagement and retention KPIs.
How to Calculate Retention Rate
Retention directly impacts dues revenue—learn to calculate it right.
How to Design a Membership Dashboard
Build financial dashboards that drive action.
Complete Guide to Membership Analytics
Master all aspects of membership measurement and analysis.