Quick Summary: Membership Dashboard Design
- One dashboard per audience: Build separate executive, retention, engagement, and financial dashboards—combining them creates clutter that no one uses.
- 5-7 metrics maximum: Research shows decision quality drops when dashboards exceed seven key metrics—be ruthless about what makes the cut.
- Every number needs comparison: Raw numbers are meaningless without context; always show vs. previous period, vs. goal, or vs. industry benchmark.
- Visual hierarchy drives scanning: Executives spend 8 seconds on dashboards—use font size, color, and position to surface what matters most.
- Lead with questions: Every chart should answer a specific question like "Are we retaining members?" rather than just displaying data.
Part of our Membership Analytics Guide
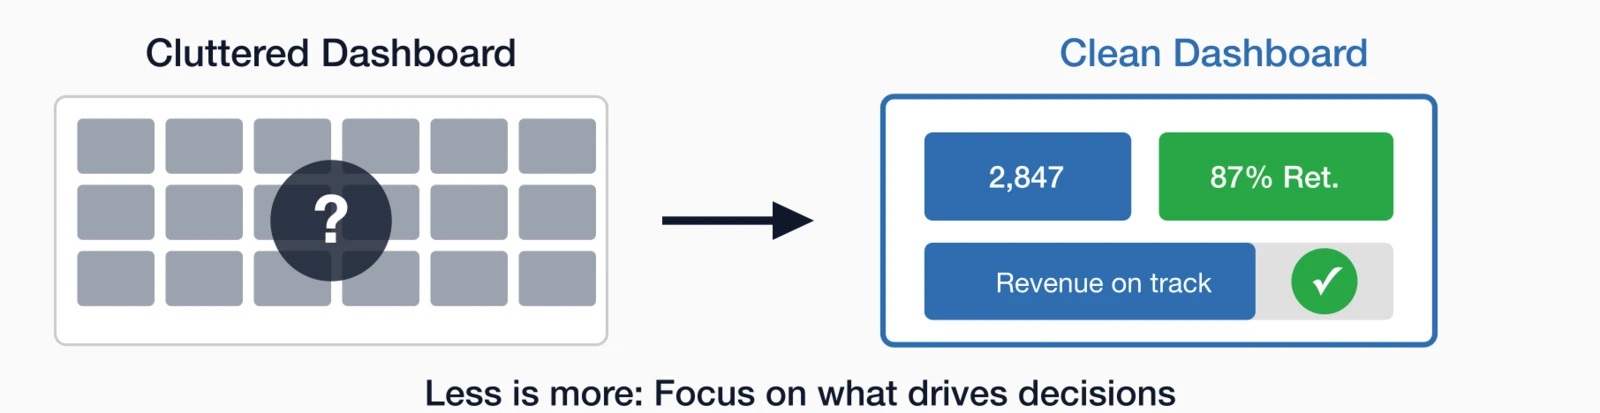
Membership dashboard design separates actionable insights from data clutter. Most association dashboards fail not because of bad data, but because of bad design.
Here's the problem: your AMS collects mountains of membership data, but when you pull up the dashboard, you see 47 charts that all look important. Nothing stands out. So you close the tab and make decisions based on gut instinct instead.
Sound familiar? After designing dashboards for hundreds of associations, I've learned that the best dashboards don't show everything. They show exactly what you need to make decisions—and nothing more. This is especially true for membership nonprofits with board reporting requirements and AMCs managing dashboards across multiple client associations.
The dashboard problem most associations have
Most association dashboards share the same problems. The technology works fine—it's the approach that fails. Here's what typical dashboards look like:
- 17+ charts crammed onto one screen
- No hierarchy—everything appears equally important
- Raw numbers without comparison or context
- Vanity metrics mixed with actionable ones
- Data from last month (or worse, last quarter)
The result? Staff stop checking the dashboard. Executives ask for "that report again" in meetings. And the data you spent years collecting sits unused.
The real problem: Bad dashboards aren't a data problem. They're a design problem. Fix the design, and suddenly your data becomes useful.
5 dashboard design principles that work
Before building any dashboard, internalize these principles. They're the difference between a dashboard that drives decisions and one that collects dust. Each addresses a specific failure mode I've seen derail well-intentioned analytics efforts.
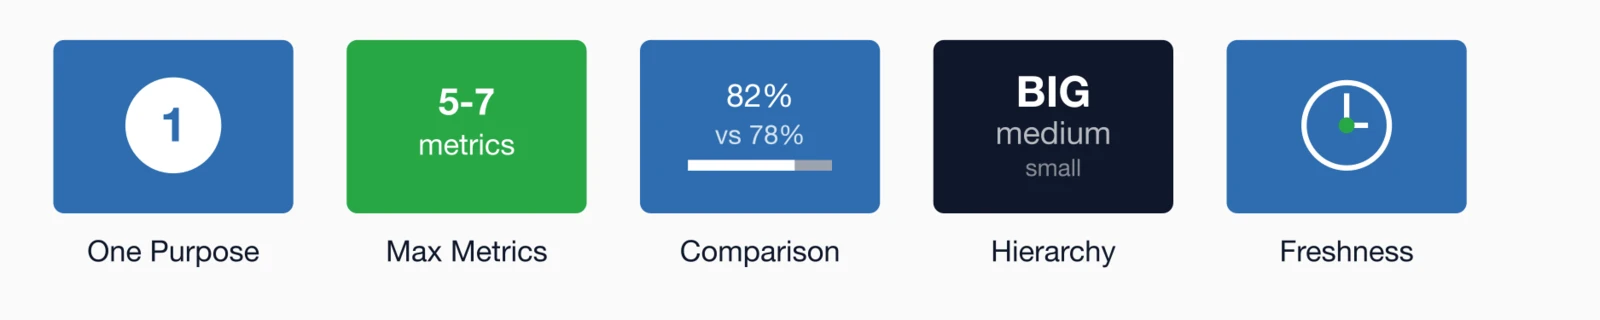
Principle 1: One purpose per dashboard
Your CEO doesn't need to see individual member engagement scores. Your membership director doesn't need revenue projections. Build separate dashboards for:
- Executive Dashboard: High-level organizational health
- Retention Dashboard: Who's at risk and why
- Engagement Dashboard: Activity patterns and trends
- Financial Dashboard: Revenue, dues, and projections
Principle 2: 5-7 metrics maximum
Studies from dashboard analytics firms consistently find that decision-making quality decreases as the number of metrics increases beyond seven. Be ruthless about what makes the cut.
Principle 3: Every number needs comparison
A retention rate of 82% sounds good. But is it? Without comparison, you can't know. Always show:
- vs. Previous period (month, quarter, year)
- vs. Goal or target
- vs. Industry benchmark
Principle 4: Visual hierarchy matters
Executives spend an average of 8 seconds scanning a dashboard. In that brief window, visual hierarchy—the arrangement of elements to signal importance—determines what they notice and what they miss. A well-designed hierarchy guides the eye to critical information first.
- Largest font = most important metric
- Color = status (red/yellow/green)
- Position = priority (top-left is seen first)
Principle 5: Freshness drives value
A dashboard showing last month's data is an archive, not a decision tool. Aim for daily refreshes on key metrics. Real-time when possible.
The executive dashboard: 30-second org health
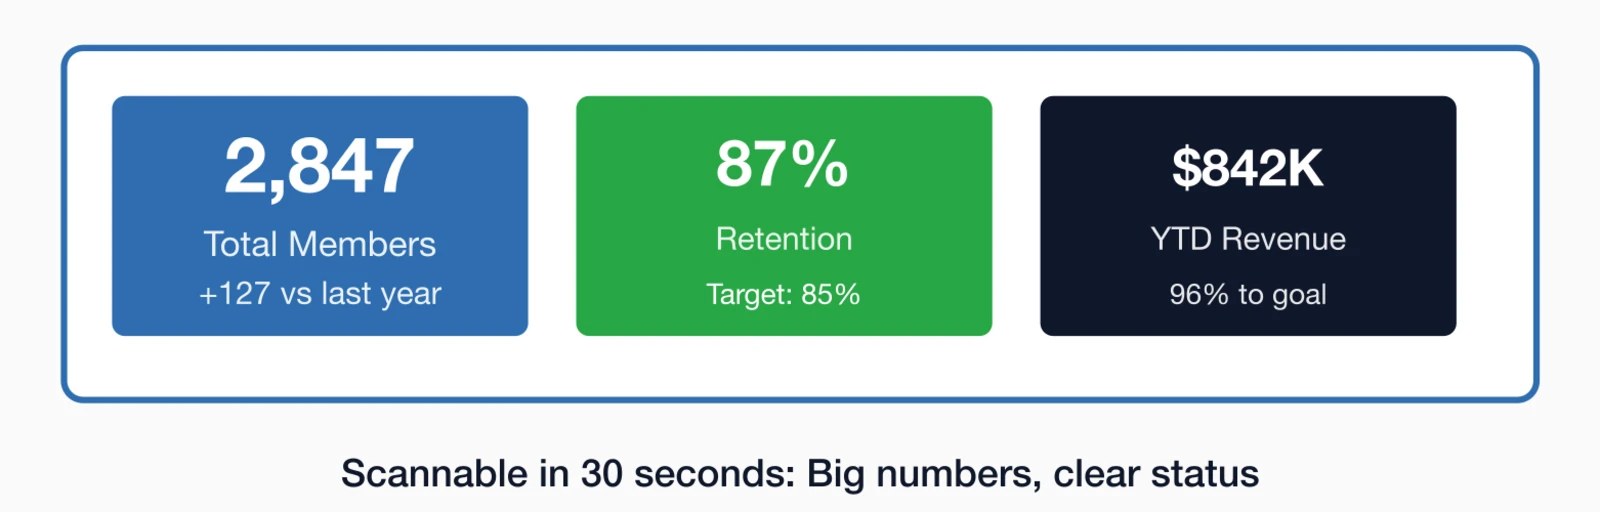
Your board and executives need to answer one question: "How healthy is our membership?" They don't have time for detailed analysis—they need to scan a screen and know whether things are on track or require attention.
This dashboard should be scannable in 30 seconds or less. No drilling down, no clicking, no interpretation needed.
What belongs on an executive dashboard
| Metric | Why It Matters | Show Comparison To |
|---|---|---|
| Total Members | Overall organization size | Last year, budget goal |
| Retention Rate | Member satisfaction signal | Last year, 85% benchmark |
| Net Growth | Are we growing or shrinking? | Goal, last year |
| Total Revenue | Financial health | Budget, last year |
| Renewals Due This Month | Immediate attention needed | Same month last year |
The retention dashboard: Find at-risk members
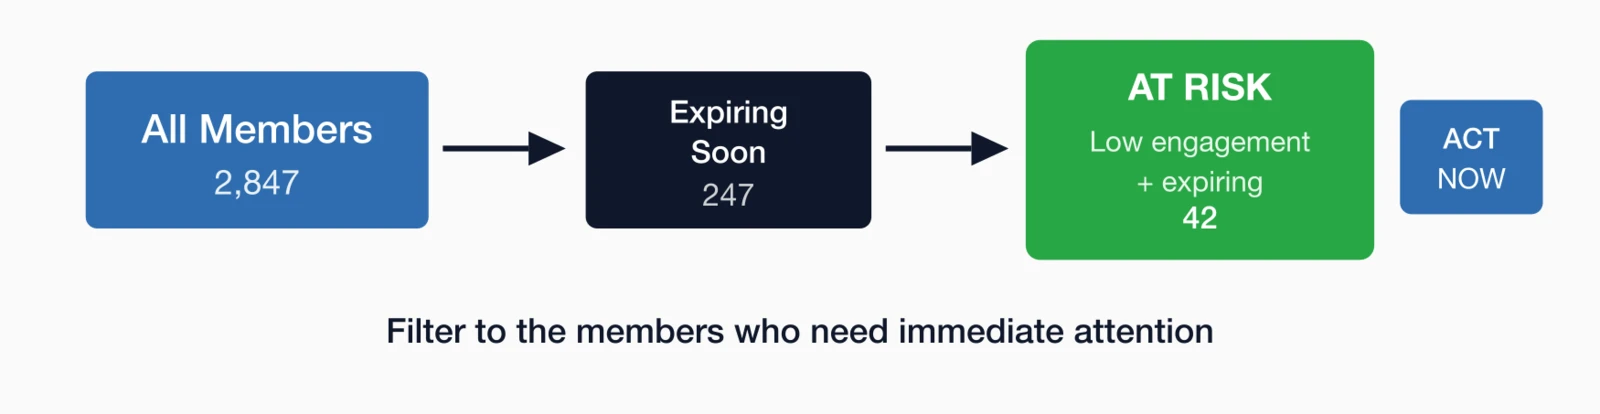
Your membership team needs to answer a different question: "Who's about to leave, and what can we do about it?" This is where data becomes intervention—identifying problems early enough to solve them.
This dashboard is operational—it should drive daily action, not just monthly reports.
Key retention dashboard elements
- Members Expiring This Month: Filterable list with contact info
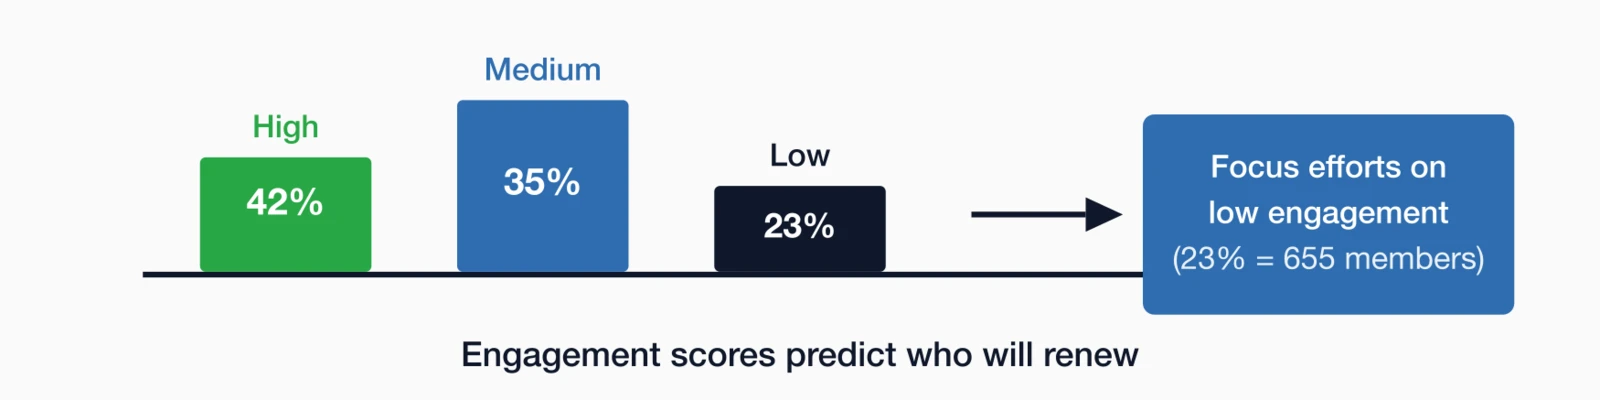
- Engagement Score Distribution: How many are highly engaged vs. at-risk?
- At-Risk Member List: Low engagement + upcoming renewal = urgent
- Renewal Rate by Cohort: Are first-year members renewing at lower rates?
- Lapsed Member Recovery: How many have we won back?
Pro Tip: Build "engagement scores" that combine multiple behaviors (logins, event attendance, email opens, resource downloads). Members with scores below 30 should trigger automated outreach before renewal time.
Retention dashboard questions to answer
- Who renews this week/month?
- Which of those are at risk (low engagement)?
- What's our first-year renewal rate vs. overall?
- Which membership types have the lowest retention?
- Are renewal campaigns working? (track response rates)
For deeper retention analysis, see our guide on 15 KPIs Every Association Should Track, which covers the retention metrics that matter most.
The engagement dashboard: Activity patterns
This dashboard answers a fundamental question: "Are members actually using their membership?" Engagement is the leading indicator of retention—track it well, and you can predict and prevent churn before it happens.
Engagement metrics to track
| Activity | What to Track | Why It Matters |
|---|---|---|
| Portal Logins | % logged in last 30/60/90 days | Shows active vs. dormant members |
| Event Attendance | % attending at least 1 event YTD | Events are high-value touchpoints |
| Email Engagement | Open rate, click rate by segment | Low openers may have wrong email |
| Resource Downloads | Which resources, how often | Shows what members value |
| Community Activity | Forum posts, group membership | Peer connection predicts retention |
The financial dashboard: Revenue health
This dashboard answers the sustainability question: "Is our membership model financially healthy?" For finance teams and executives, this connects membership metrics to the bottom line that keeps the organization running.
Key financial metrics
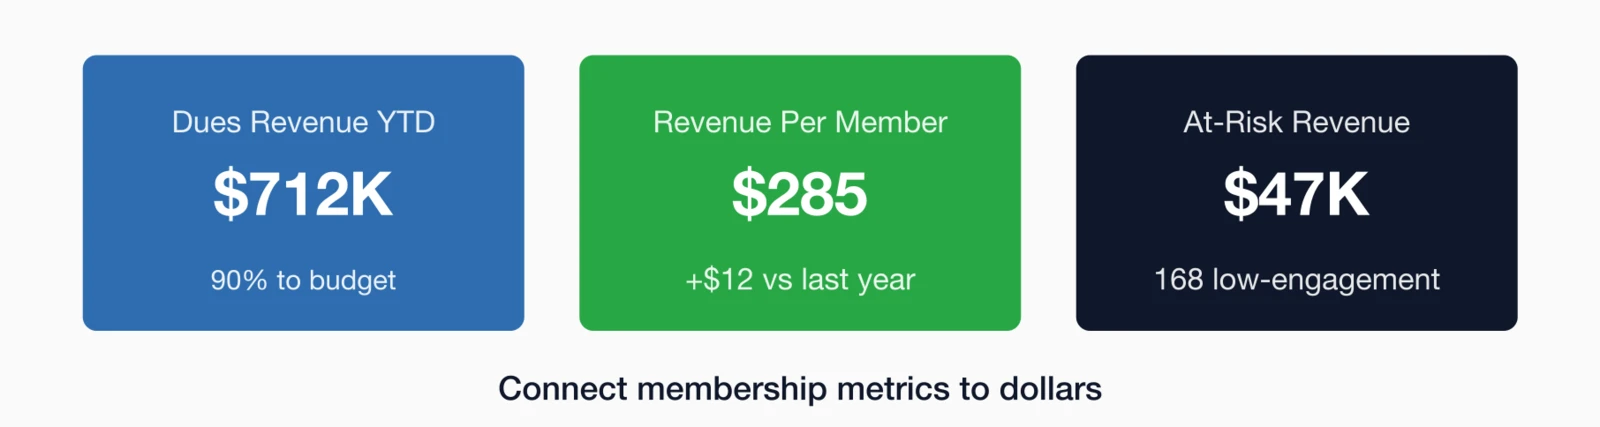
- Total Dues Revenue: YTD vs. budget vs. last year
- Revenue Per Member: Total revenue / total members (trending up or down?)
- Non-Dues Revenue Ratio: What % comes from non-dues sources?
- Accounts Receivable: Outstanding payments and aging
- Revenue Forecast: Based on current renewal pipeline
Financial dashboard questions
- Are we on track for budget this year?
- How much revenue is at risk (members likely to not renew)?
- What's the revenue impact of our retention rate?
- Are we diversifying beyond dues revenue?
- What's the LTV:CAC ratio for new members?
Revenue insight: A 5% improvement in retention rate typically delivers 15-25% more revenue over 5 years due to compounding effects. Build this into your financial projections.
How to build your dashboard (step by step)
Ready to build? Here's the process I recommend—it keeps you focused on decisions rather than getting lost in data possibilities. The time estimates are realistic for someone who already has access to their data.
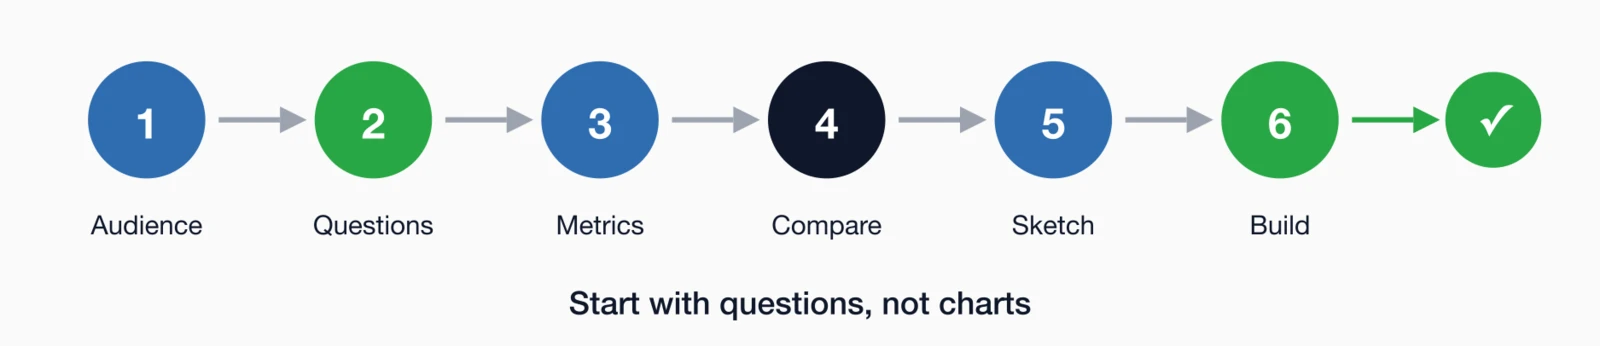
Step 1: Define the audience (5 minutes)
Who will use this dashboard? An executive? Membership staff? Finance? Each needs different data at different levels of detail.
Step 2: List the questions (15 minutes)
Write down 5-7 questions this dashboard needs to answer. Not metrics—questions. For example:
- "Is our retention improving or declining?"
- "Which members are at risk of not renewing?"
- "Are we on track for revenue goals?"
Step 3: Choose metrics for each question (30 minutes)
For each question, identify the single best metric to answer it. Resist the urge to add 3 metrics for one question.
Step 4: Define comparisons (15 minutes)
For each metric, decide: What will you compare it to? Last year? Goal? Benchmark? A number without comparison is just trivia.
Step 5: Sketch the layout (20 minutes)
On paper or whiteboard, sketch where each element goes. Biggest number = most important = top left position.
Step 6: Build and iterate (2-4 hours)
Build in your reporting tool, then show it to users. Ask: "What question can't you answer from this?" Add only what's truly missing.
7 dashboard mistakes to avoid
These mistakes are common because they feel like good ideas at the time. Understanding why each fails helps you resist the temptation when building your own dashboards.
1Too many metrics
If everything is highlighted, nothing is. Stick to 5-7 metrics maximum.
2No comparisons
"2,847 members" is trivia. "2,847 members (+127 vs. last year, 96% to goal)" is insight.
3Stale data
A monthly dashboard drives monthly decisions. Aim for daily updates on key metrics.
4Missing alerts
Dashboards should surface problems automatically. Red/yellow/green status indicators make issues obvious.
5One dashboard for everyone
Your CEO doesn't need the same view as your membership coordinator. Build role-specific dashboards.
6Charts without context
A bar chart showing this month's renewals means nothing without historical context. Add trend lines.
7No clear hierarchy
Use font size, color, and position to create visual hierarchy. The most important metric should be the largest and positioned top-left.
How i4a helps you build better dashboards
Building effective dashboards requires both good design principles and the right tools. i4a's membership reporting and analytics platform is designed with these principles built in:
- Pre-Built Dashboard Templates: Retention and financial dashboards ready to use
- Custom Report Builder: Create exactly the views you need
- Automated Insights: AI-powered alerts for at-risk members and unusual patterns
- Real-Time Data: Dashboards refresh daily (or more frequently)
- Role-Based Access: Different dashboards for different staff roles
- Mobile-Friendly: Check key metrics from your phone
For a comprehensive understanding of what metrics to include in your dashboards, explore our Complete Guide to Membership Analytics.
Key takeaways
- One dashboard per audience: Executive, retention, engagement, and financial dashboards serve different purposes—don't combine them
- 5-7 metrics maximum: Research shows decision quality drops when dashboards exceed 7 key metrics—be ruthless about what makes the cut
- Lead with the question: Every chart should answer a specific question ("Are we retaining members?") not just display data ("Here's a retention chart")
- Comparison is everything: A number without context is meaningless—always show vs. last month, vs. last year, or vs. goal
- Design for scanning: Executives spend 8 seconds on dashboards—put critical numbers in large text with clear red/yellow/green indicators
Ready to Build Dashboards That Drive Action?
See how i4a's association management software gives you the reporting and analytics tools to make data-driven decisions.
Request a DemoRelated resources
Complete Guide to Membership Analytics
Everything you need to know about tracking, measuring, and improving membership performance.
See how i4a's built-in reporting and analytics tools help you create actionable dashboards.
15 KPIs Every Association Should Track
The essential metrics to include in your dashboards.
How to Use Member Data to Make Better Decisions
Turn dashboard insights into strategic action.