Quick Summary: Predictive Retention Analytics
- Engagement scores predict churn: Members with low engagement (bottom 25%) are 3-4x more likely to lapse than highly engaged members.
- Start with simple scoring: A basic weighted model combining logins, event attendance, and email engagement outperforms gut instinct by 40-60%.
- Watch for warning signals: Login decline, event non-attendance, email disengagement, late payments, and support complaints all indicate elevated risk.
- Timing matters most: Interventions 90+ days before renewal are twice as effective as 30-day outreach—by then, most decisions are already made.
- Expect measurable results: Associations implementing predictive retention programs typically see 5-15% improvement in at-risk member retention.
Part of our analytics and reporting resource center
Predictive analytics for retention identifies at-risk members months before renewal using data you already have. Here's a ready-to-use engagement scoring model, 12 early warning signals, and intervention strategies—no data science team required.
That's the promise of predictive analytics. Instead of reacting to churn after it happens, you predict it, intervene early, and save members who would have otherwise been lost.
The good news: You don't need a data science team or expensive AI tools. With the data you already have in your AMS, you can build a practical retention prediction system that works. According to the MGI 2025 Association Outlook Report, 43% of associations are now conducting data analytics—nearly triple the number from just a few years ago—demonstrating the growing recognition that data-driven approaches yield better retention outcomes.
What is predictive analytics for retention?
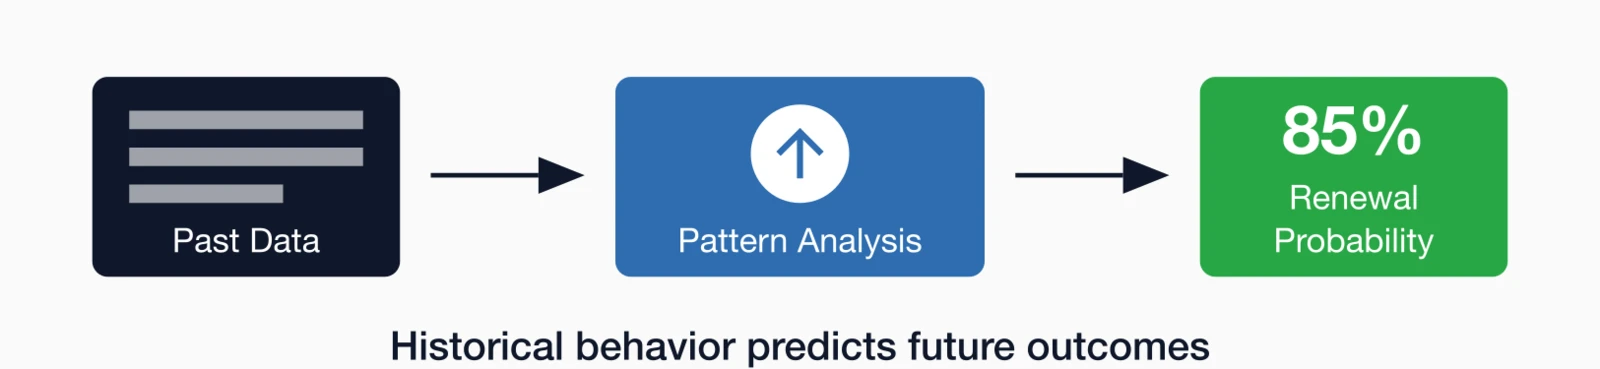
If you've ever wished you could see into the future—knowing which members will renew and which will quietly slip away—predictive analytics is the closest thing to a crystal ball that actually works. At its core, predictive analytics uses patterns from historical data to forecast future outcomes. For membership organizations, that means analyzing years of member behavior to identify signals that predict who's at risk of lapsing long before renewal season arrives.
- Identifying which members are likely to lapse before they actually do
- Understanding which behaviors predict non-renewal
- Prioritizing outreach to members most at risk
- Measuring intervention effectiveness
Reactive vs. predictive retention
| Reactive Approach | Predictive Approach |
|---|---|
| Send renewal notice 30 days before expiration | Identify at-risk members 6 months out |
| Same message to all members | Tailored outreach based on risk level |
| React after member shows disengagement | Intervene before disengagement becomes critical |
| Survey lapsed members to understand why | Address issues before they cause lapse |
The key insight: By the time a member is up for renewal, their decision is often already made. Predictive analytics lets you influence that decision months earlier.
Building an engagement score
Before you can predict churn, you need a way to measure member engagement. An engagement score is a single number—typically on a 0-100 scale—that represents how active and connected each member is with your organization. Think of it as a health check: higher scores indicate thriving members, while lower scores signal potential problems. Building this score is the foundation of any predictive retention program, and you can create a useful one with data you already have.

Sample scoring model
Here's a simple weighted model you can implement:
| Activity | Points | Criteria |
|---|---|---|
| Portal Login | 0-25 | 25 pts if logged in last 30 days; 15 pts if 30-60 days; 5 pts if 60-90 days; 0 if 90+ days |
| Event Attendance | 0-20 | 20 pts if 3+ events YTD; 15 pts if 2 events; 10 pts if 1 event; 0 if none |
| Email Engagement | 0-15 | 15 pts if >30% open rate; 10 pts if 15-30%; 5 pts if <15%; 0 if hard bounced |
| Resource Downloads | 0-10 | 10 pts if 5+ downloads YTD; 5 pts if 1-4 downloads; 0 if none |
| Community Activity | 0-10 | 10 pts if active poster; 5 pts if engaged reader; 0 if no activity |
| Tenure | 0-10 | 10 pts if 5+ years; 7 pts if 3-5 years; 5 pts if 1-3 years; 0 if <1 year |
| Certification | 0-10 | 10 pts if holds certification; 0 if not |
Interpreting engagement scores
- 80-100: Highly engaged. Low churn risk. Focus on advocacy and leadership opportunities.
- 60-79: Moderately engaged. Monitor for declines. Standard renewal process.
- 40-59: Low engagement. Elevated risk. Proactive outreach needed.
- 0-39: At risk. High probability of non-renewal. Urgent intervention required.
12 early warning signals of churn
While engagement scores give you a general picture, specific behavioral changes often signal trouble more clearly. These warning signals are the red flags that experienced membership professionals learn to watch for—sudden drops in activity, changes in payment behavior, or shifts in how members interact with communications. When you spot these patterns early, you have time to intervene before disengagement becomes a firm decision to leave.

Signal combinations that predict churn
Individual signals are useful. Combinations are powerful:
- No login + No email opens + First-year member: 70-80% likely to lapse
- Event attendance dropped + Switched off auto-pay: 60-70% likely to lapse
- Support complaint + Engagement decline: 50-60% likely to lapse
Building a simple prediction model
The phrase "prediction model" might conjure images of complex algorithms and data science teams, but you can build a surprisingly effective model with basic math and the data in your AMS. The key is translating engagement scores and warning signals into renewal probability estimates, then using those probabilities to prioritize your retention efforts.
Step 1: Calculate renewal probability
Assign probability based on engagement score:
| Engagement Score | Historical Renewal Rate | Predicted Probability |
|---|---|---|
| 80-100 (Highly Engaged) | 92% | High (90%+) |
| 60-79 (Moderate) | 78% | Medium (75-85%) |
| 40-59 (Low) | 55% | Low (50-65%) |
| 0-39 (At Risk) | 30% | Very Low (<40%) |
Step 2: Adjust for warning signals
Reduce probability for each warning signal present:
- Each behavioral signal: -5 percentage points
- Each transactional signal: -8 percentage points
- First-year member: -15 percentage points
Step 3: Segment by risk level
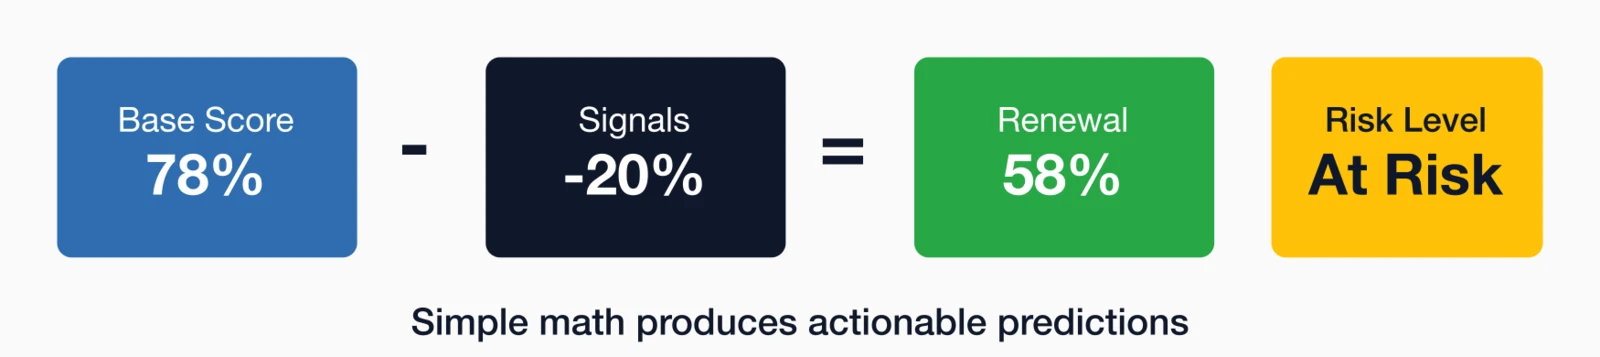
Example calculation:
- Member A: Engagement score 75 (base: 78% probability)
- Warning signals: No login 60+ days (-5%), First-year (-15%)
- Adjusted probability: 78% - 5% - 15% = 58%
- Classification: At Risk
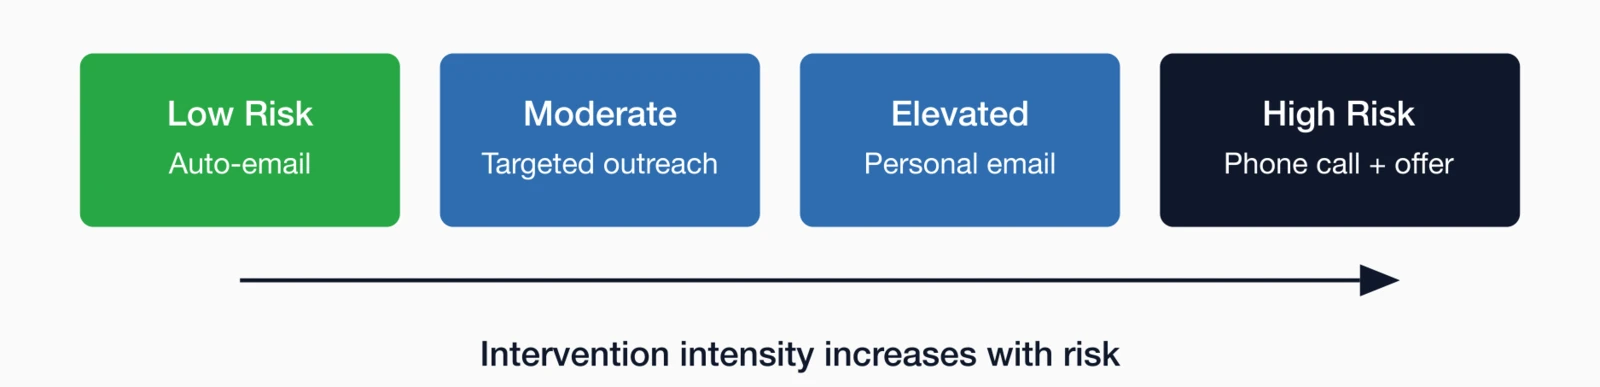
Intervention strategies by risk level
Once you know which members are at risk, you need a plan for what to do about it. The intervention strategies that work for a member at moderate risk won't be appropriate for someone about to lapse. High-risk members need personal attention; moderate-risk members might just need a well-timed reminder of value. Matching your intervention intensity to the risk level ensures you're investing resources where they'll have the greatest impact.
| Risk Level | When to Act | Intervention Strategy |
|---|---|---|
| High Risk (<40% probability) | Immediately (6+ months before renewal) | Personal outreach, value reminder call, special offer, member services check-in |
| Elevated Risk (40-60% probability) | 90-120 days before renewal | Re-engagement campaign, highlight unused benefits, peer connection, survey |
| Moderate Risk (60-80% probability) | 60 days before renewal | Standard renewal sequence with value messaging, early renewal discount |
| Low Risk (>80% probability) | 30 days before renewal | Simple renewal reminder, multi-year option, upgrade offer |
High-impact intervention tactics
- Personal phone call: A 5-minute call from staff can recover 15-25% of at-risk members
- Peer connection: Introduce them to an active member with similar interests
- Benefit spotlight: Show them specific benefits they haven't used
- Win-back offer: Discounted or extended membership for at-risk renewal
- Exit interview offer: "Before you go, can we understand why?"
Timing is critical: Interventions 90+ days before renewal are twice as effective as 30-day interventions. By the time most associations start renewal campaigns, it's often too late for at-risk members.
Implementation: Getting started
Building a predictive retention system doesn't require a massive technology investment or months of preparation. Most associations can get a basic system running within 6-8 weeks using data they already have. The key is starting simple, validating that your model actually predicts churn, and then refining it based on real results.
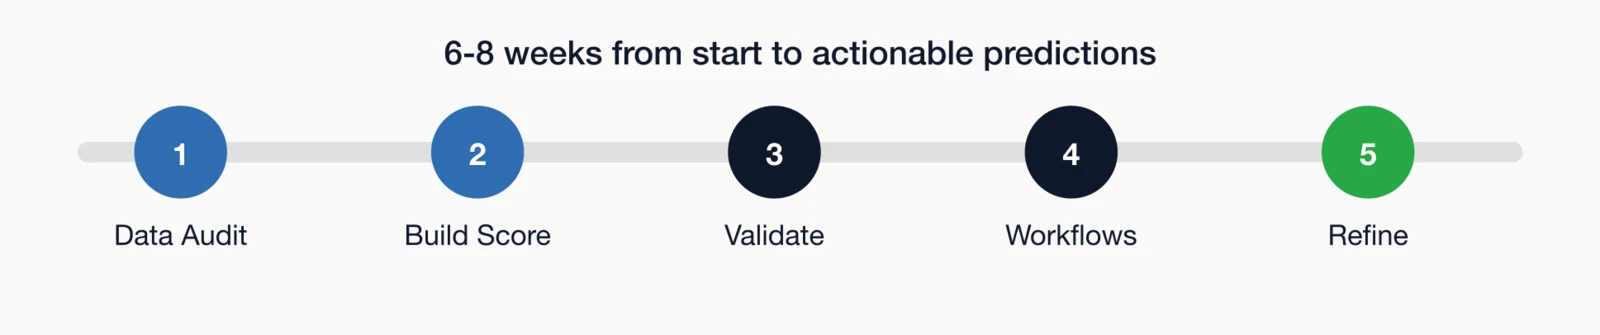
Phase 1: Data audit (week 1-2)
- Identify what engagement data you can track (logins, events, emails, etc.)
- Pull historical data: which members renewed vs. lapsed in the past 2-3 years?
- Look for patterns: what behaviors correlated with non-renewal?
Phase 2: Build engagement score (week 3-4)
- Define your scoring components and weights (start simple)
- Calculate scores for all current members
- Segment by score range
Phase 3: Validate the model (week 5-6)
- Check: Do low scores correlate with past non-renewals?
- Adjust weights if needed
- Set threshold for "at-risk" designation
Phase 4: Build intervention workflows (week 7-8)
- Create automated alerts for at-risk members
- Develop intervention scripts and offers
- Assign staff responsibility for high-risk outreach
Phase 5: Monitor and refine (ongoing)
- Track intervention success rates
- Compare predicted vs. actual renewal rates
- Refine scoring model based on results
Measuring success
Any predictive system is only as good as its results. You need to track whether your predictions are accurate and whether your interventions actually save members who would have otherwise lapsed. Without measurement, you're flying blind—unable to know if your engagement scores are meaningful or if your intervention efforts are paying off.
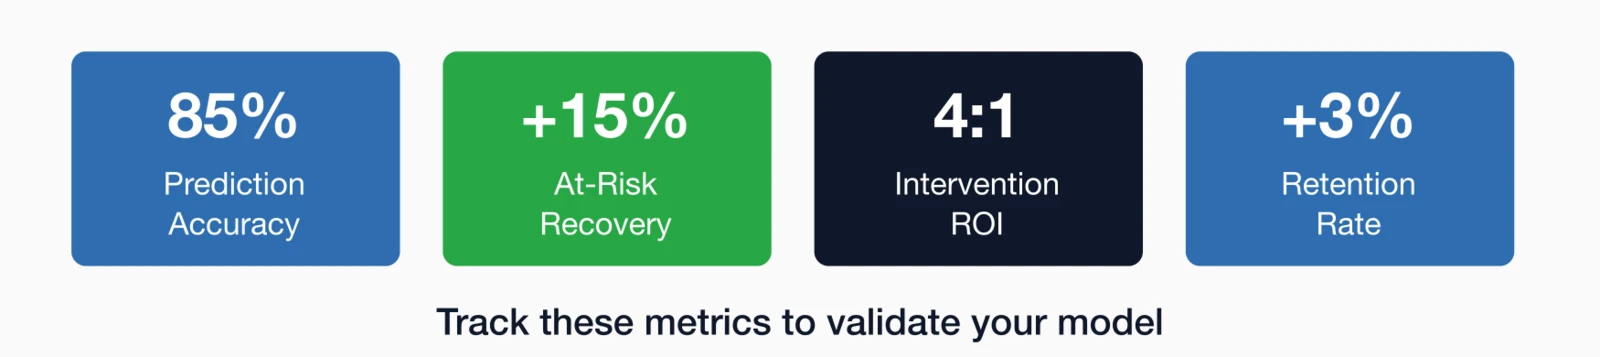
Model accuracy
- Prediction accuracy: What % of members predicted to lapse actually did? What % predicted to renew actually did?
- False positive rate: How many "at-risk" members actually renewed without intervention?
- False negative rate: How many members we thought were safe actually lapsed?
Intervention effectiveness
- At-risk renewal rate: What % of at-risk members renewed after intervention?
- Intervention ROI: Revenue saved vs. cost of intervention efforts
- Response rate: How many at-risk members engaged with outreach?
Overall impact
- Retention rate change: Has overall retention improved since implementing predictive analytics?
- Revenue impact: Additional dues revenue from retained members
- Staff efficiency: Is the team focusing outreach more effectively?
Real results: What to expect
Predictive analytics isn't magic—it won't save every at-risk member. But it does allow you to focus your limited resources on the members most likely to benefit from intervention, rather than spreading effort equally across members who will renew anyway and members who've already made up their minds. Here's what realistic improvement looks like based on associations that have implemented these approaches.
| Metric | Typical Improvement | Top Performers |
|---|---|---|
| At-risk member retention | +10-15% | +20-25% |
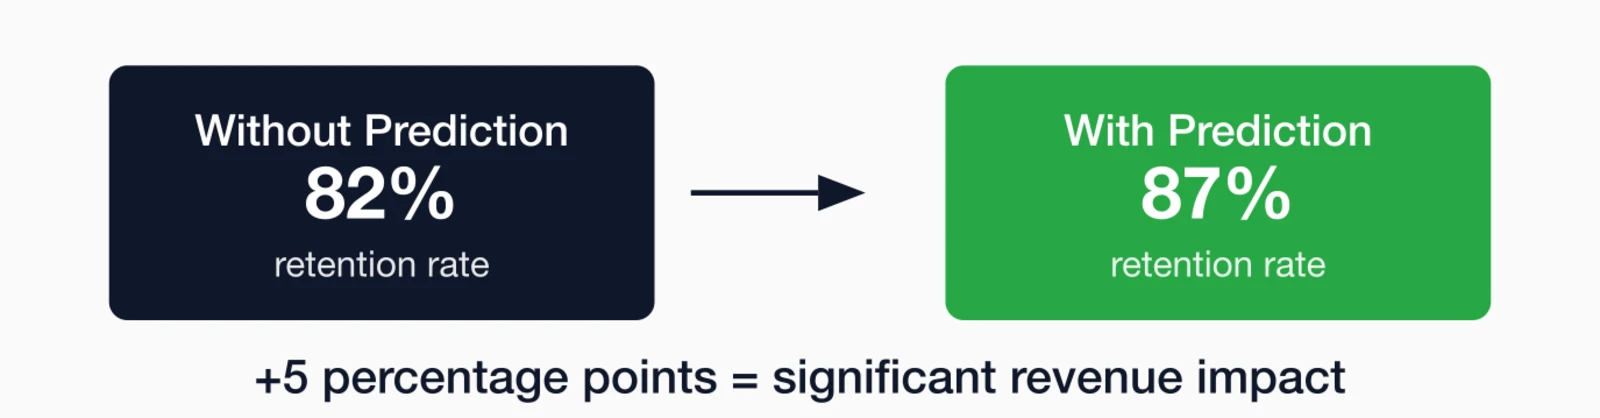
| Overall retention rate | +2-4 percentage points | +5-7 percentage points |
| First-year retention | +5-8 percentage points | +10-12 percentage points |
| Revenue impact | $50K-$200K annually | $200K-$500K+ annually |
Remember: Even modest improvements compound. A 3% retention improvement each year for 5 years results in a membership base 16% larger than without the improvement—same acquisition, just better retention.
Getting started with retention prediction
The good news: you likely already have the data you need to start predicting which members are at risk. Your AMS contains the engagement signals that matter most—event attendance, email interactions, login activity, renewal history, and more. By analyzing this data systematically, you can identify patterns that indicate a member may be disengaging before they lapse.
Start by exporting data on the early warning signals mentioned above. Look for members showing multiple risk factors and prioritize personal outreach to those individuals. Even a simple monthly review of engagement data—tracked in a spreadsheet if needed—can help you catch at-risk members before it's too late.
For a deeper dive into what metrics to track and how to build your own retention analysis, see our Complete Guide to Membership Analytics.
Key takeaways
- Engagement scores predict churn: Members with low engagement scores (bottom 25%) are 3-4x more likely to lapse than highly engaged members
- Start simple: A basic weighted scoring model (logins + events + email opens) outperforms gut instinct by 40-60%
- 12 early warning signals: Login decline, event non-attendance, email disengagement, late payments, support complaints
- Intervention timing matters: Reaching at-risk members 90+ days before renewal is 2x more effective than 30-day outreach
- Typical results: Associations implementing predictive retention programs see 5-15% improvement in at-risk member retention
Ready to Improve Member Retention?
i4a's association management software helps you manage member data, automate renewals, and keep your membership organized—so you can focus on the personal outreach that saves at-risk members.
Talk to UsRelated resources
Complete Guide to Membership Analytics
Everything you need to know about membership data and analytics.
Turn predictions into action with proven retention strategies.
How to Calculate Retention Rate
Get the foundation right before building prediction models.
How to Reduce Membership Churn
10 proven strategies to act on your predictions.