Quick Summary: Retention Rate Calculation
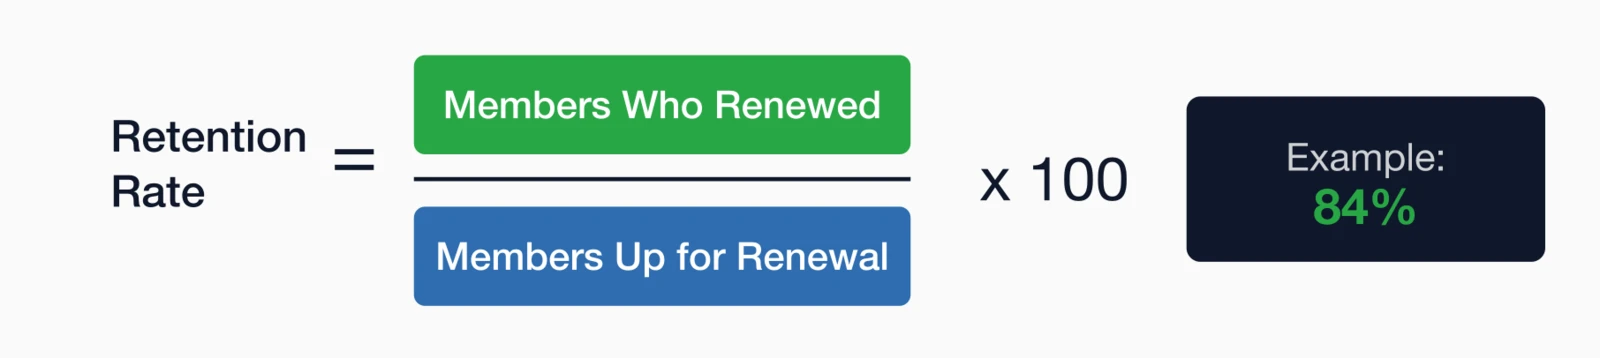
- Basic formula: Retention Rate = (Members who renewed ÷ Members up for renewal) × 100—exclude new members from both numbers.
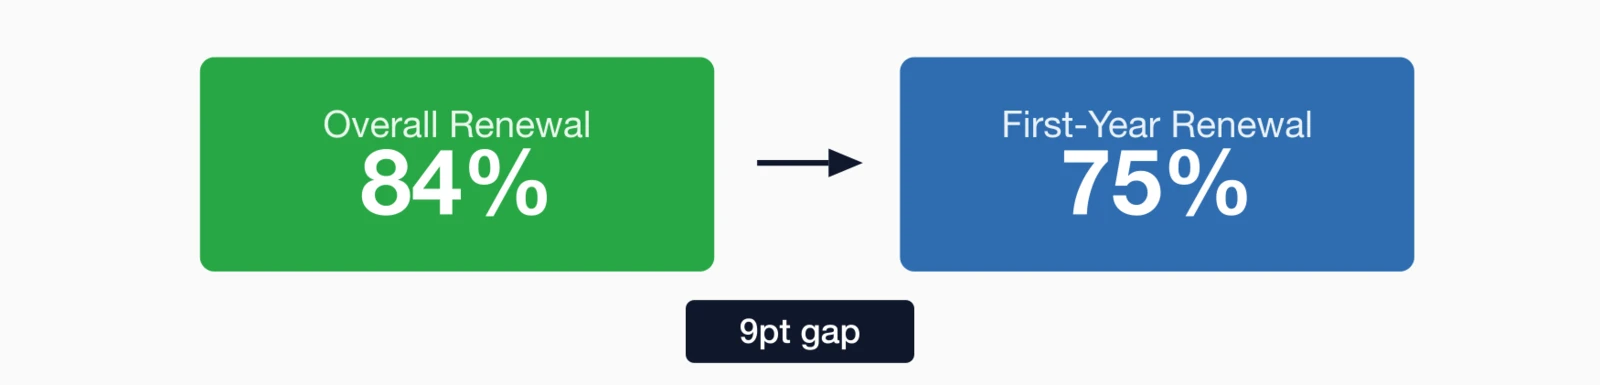
- Industry benchmarks: Median overall renewal is 84%, but first-year members renew at just 75%—a critical 9-point gap to address.
- Track first-year separately: Overall retention masks your biggest problem; first-year retention is the single best predictor of future membership health.
- Use rolling 12-month: Calculate monthly and average over 12 months to catch declining trends 6-9 months faster than annual calculations.
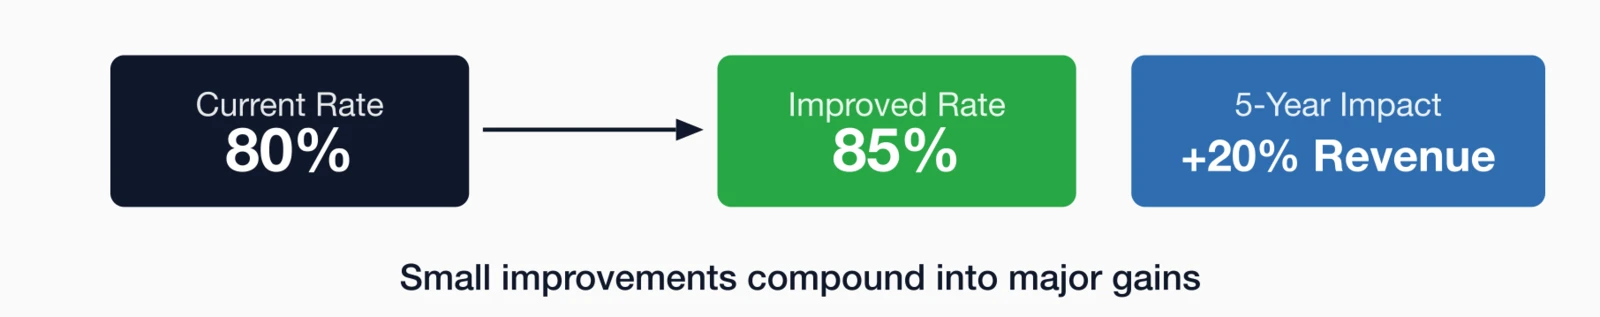
- Compounding impact: A 5% retention improvement typically delivers 15-25% more revenue over 5 years due to compounding effects.
Part of our guide to analytics for membership organizations
Retention rate calculation reveals your organization's health—and understanding the gap between first-year and established member renewal rates is your biggest opportunity. Here's how to calculate it correctly.
Some count anyone who was a member last year. Others only count those who were up for renewal. Some include lapsed members who came back; others exclude them. The result? Associations comparing apples to oranges—and making decisions based on misleading numbers.
In this guide, I'll show you exactly how to calculate retention rate the right way, what benchmarks to compare against, and how to use this metric to actually improve your membership.
Why retention rate is your most important metric
Before diving into formulas and calculations, it's worth understanding why retention deserves more attention than most organizations give it. While new member acquisition gets the spotlight in board presentations and marketing budgets, retention is the silent multiplier that determines whether your organization grows, stagnates, or shrinks over time. The difference between an 80% and 85% retention rate might seem small, but compounded over years, it transforms your membership trajectory completely. Here's the math that changed how I think about membership:
The 80/80 Rule:
- Acquiring a new member costs 5-7x more than retaining an existing one
- A member who stays 5 years generates 3x the lifetime value of one who stays 2 years
- An association with 80% retention will be 50% larger in 10 years than one with 75% retention (same acquisition rate)
Retention rate isn't just a metric—it's your organization's vital sign. It tells you whether members find value in what you offer. And unlike satisfaction surveys, retention rate is based on actual behavior: did they pull out their wallet and renew?
What retention rate really measures
- Value delivery: Are members getting what they expected?
- Pricing alignment: Is membership worth the cost?
- Engagement success: Are members connected to your community?
- Communication effectiveness: Do members know what's available?
- Competitive position: Are alternatives more attractive?
The basic retention rate formula
Calculating retention rate correctly is more nuanced than it first appears. Many organizations use simplified formulas that conflate new member growth with actual retention, leading to misleading conclusions about their membership health. Getting the formula right—and understanding exactly what numbers go into it—is the foundation for everything that follows. Let's start with the fundamental formula:
Key terms defined
| Term | Definition | Important Notes |
|---|---|---|
| Members up for renewal | Members whose membership expired during the measurement period | Don't include new members who joined during the period |
| Members who renewed | Members who paid for another membership term | Include late renewals within your grace period |
| Grace period | Time after expiration when members can still renew | Typically 30-90 days; be consistent in your calculations |
Critical distinction: Retention rate measures renewals as a percentage of those due to renew. It's different from "membership change" which compares total members year-over-year (and includes new member acquisition).
Use our free Membership Retention Rate Calculator to measure your current retention, see how you compare to benchmarks, and model the revenue impact of improving by just a few percentage points.
3 ways to calculate retention rate
There's no single "correct" way to calculate retention—the right approach depends on how your membership works. An organization with calendar-year memberships will measure differently than one with rolling anniversary dates, and both will differ from organizations tracking real-time trends. Understanding these three methods helps you choose the approach that gives you the most actionable insights for your specific situation. The formula above is simple, but there are multiple valid approaches. Choose the one that fits your membership model.

Method 1: Anniversary-based (most common)
Best for: Organizations with rolling membership periods (join anytime, expire one year later)
Formula:
For each month, calculate: Members renewed that month ÷ Members who were due that month
Then average the 12 months for annual retention rate.
Example:
- January: 85 renewed / 100 due = 85%
- February: 78 renewed / 95 due = 82%
- ... (continue for 12 months)
- Annual retention: Average of all months = 83%
Method 2: Calendar-year based
Best for: Organizations where all memberships run January-December
Formula:
Members who renewed for current year ÷ Total members at end of previous year × 100
Example:
- Members on Dec 31, 2025: 2,500
- Members who renewed for 2026: 2,100
- Retention rate: 2,100 / 2,500 = 84%
Method 3: Rolling 12-month
Best for: Real-time tracking and early problem detection
Formula:
Sum of renewals (past 12 months) ÷ Sum of members due (past 12 months) × 100
Why I recommend this method: It gives you current retention rate at any point in time, updated monthly. You'll catch declining trends 6-9 months before an annual calculation would.
2025 industry benchmarks
Numbers only become meaningful when compared to something. Without benchmarks, you have no way to know if your 82% retention rate represents strong performance or a problem requiring urgent attention. The challenge is that benchmarks vary significantly by organization type, membership model, and industry—so generic averages can be misleading. Here's the authoritative data that helps you contextualize your own results. Now for the question everyone asks: "Is our retention rate good?"
The 2025 Membership Marketing Benchmarking Report from Marketing General Inc. provides authoritative data based on surveys of hundreds of associations:
- Median overall renewal rate: 84%
- Median first-year renewal rate: 75% (a critical 9-point gap)
- 45% of associations reported membership growth in 2024
Here are benchmarks compiled from the MGI report and our experience working with hundreds of associations:
Detailed benchmarks by organization type
| Organization Type | Typical Range | Top Performers | Notes |
|---|---|---|---|
| Trade Associations | 80-88% | 90%+ | Corporate members tend to have higher retention |
| Professional Societies | 75-85% | 88%+ | Required credentials boost retention |
| Chambers of Commerce | 70-80% | 85%+ | Economic conditions impact business members |
| Charities/Nonprofits | 60-75% | 80%+ | Donor retention typically lower than membership |
| AMCs (Client Retention) | 90-95% | 97%+ | High switching costs for association clients |
First-year member warning
Here's the statistic that should keep you up at night: According to MGI's 2025 data, first-year members renew at a median rate of just 75%—that's 9 percentage points lower than the 84% overall renewal rate.
This means your overall retention rate masks a critical problem. If you're acquiring lots of new members but losing them in year one, your numbers look fine... until acquisition slows down. The good news? 25% of associations started new onboarding programs in 2024, recognizing first-year retention as their highest-ROI investment.
Track separately: Always calculate first-year retention rate separately from overall retention. This single metric is often the best predictor of future membership health.
Cohort analysis: The deep dive
A single overall retention rate hides as much as it reveals. Members who joined ten years ago behave very differently from those who joined last month, and lumping them together masks critical patterns that could guide your strategy. Cohort analysis breaks your membership into groups based on when they joined, allowing you to spot trends, identify problem areas, and target interventions with precision. Overall retention rate is useful, but cohort analysis reveals the real story.
What is cohort analysis?
Instead of looking at all members together, you group them by when they joined (their "cohort") and track each group's retention over time.
Example cohort view:
| Cohort (Join Year) | Year 1 | Year 2 | Year 3 | Year 4 | Year 5 |
|---|---|---|---|---|---|
| 2021 Joins | 100% | 68% | 82% | 87% | 89% |
| 2022 Joins | 100% | 65% | 80% | 85% | - |
| 2023 Joins | 100% | 62% | 78% | - | - |
| 2024 Joins | 100% | 60% | - | - | - |
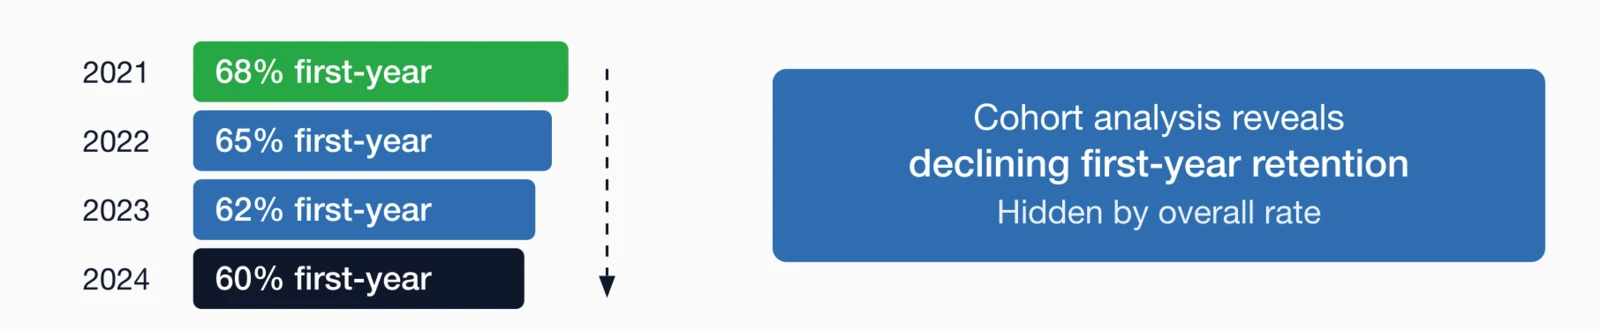
What this cohort data reveals
- Year-1 retention is declining: 68% → 65% → 62% → 60% suggests onboarding or value problems
- Year-2 and beyond are stable: Once members make it past year 1, retention improves
- Focus your efforts on year 1: The biggest opportunity is preventing that first-year drop
For more on using cohort analysis for retention, see our Complete Guide to Membership Analytics.
Related metrics you should also track
Retention rate is powerful, but it tells only part of the story. Pairing it with complementary metrics gives you a complete picture of your membership health—from understanding how much revenue you're losing to churn, to calculating whether your acquisition spending makes financial sense. These related metrics work together to inform smarter decisions about where to invest your limited resources. Retention rate doesn't exist in isolation. Track these related metrics for the full picture:
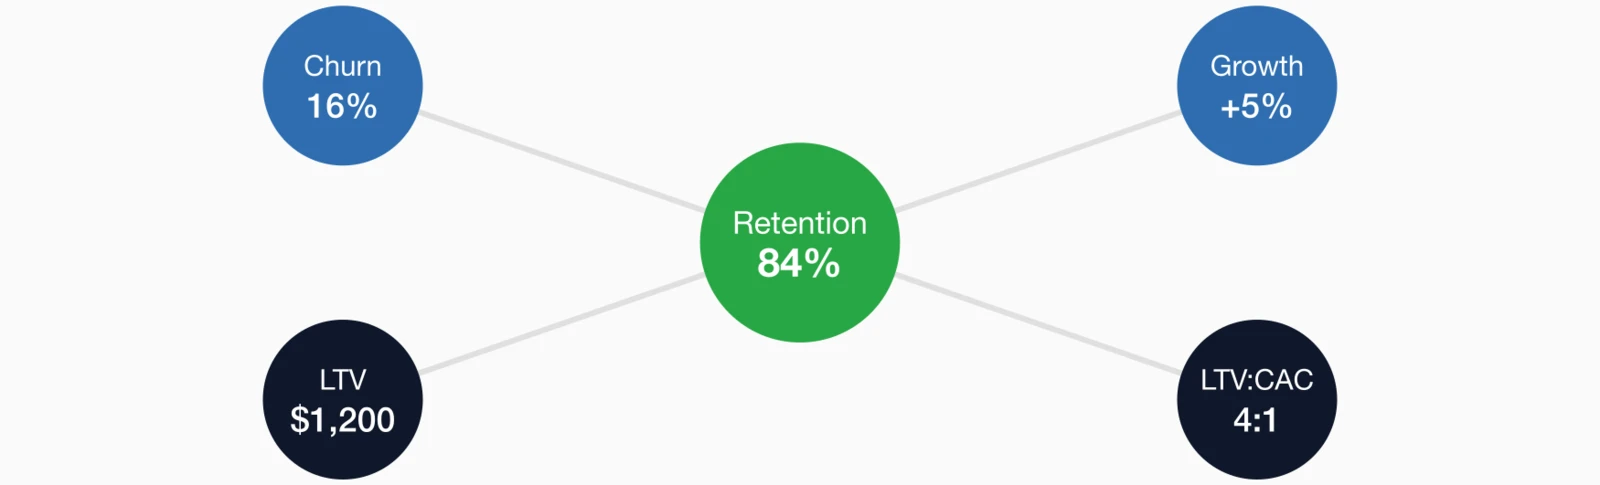
Churn rate
The inverse of retention. If retention is 82%, churn is 18%.
Net member growth rate
Accounts for both new members and lost members.
Member lifetime value (LTV)
How much total revenue a member generates over their lifetime.
Ltv:cac ratio
Compares lifetime value to acquisition cost. Should be at least 3:1.
Learn more about these calculations in 15 KPIs Every Association Should Track.
7 factors that impact retention rate
Metrics are only useful if they lead to action. Once you know your retention rate, the next question is what's driving it—and more importantly, what you can influence. Some factors are largely outside your control (economic conditions, career changes), but many are directly tied to decisions you make about onboarding, communication, and member experience. Knowing your retention rate is step one. Understanding what drives it is where improvement happens.

Perceived value vs. cost
Members ask: "Was this worth what I paid?" If benefits feel intangible or unused, renewal is less likely.
Early engagement (first 90 days)
Members who engage within the first 90 days are 2-3x more likely to renew. Those who never log in or attend an event often don't make it to year two.
Community connection
Members who know other members renew at higher rates. Peer relationships create switching costs that price alone can't.
Renewal experience
Friction in the renewal process loses members. Auto-pay increases retention by 10-15% on average.
Communication relevance
Members who receive targeted, relevant communications renew at higher rates than those receiving generic broadcasts.
Life/career changes
Job changes, retirements, and career pivots cause lapse. Some is unavoidable, but offering membership transfers or alumni programs helps.
Economic conditions
Budget cuts and economic downturns impact retention—especially for corporate members paying dues from company budgets.
How to improve your retention rate
Understanding retention metrics is valuable, but the real payoff comes from using that understanding to drive better outcomes. The good news is that retention improvements are achievable—often faster than organizations expect. Focus on the tactics that address your specific weaknesses, whether that's first-year onboarding, renewal friction, or engagement with at-risk members. Here are the highest-impact tactics I've seen work across hundreds of associations:
Fix first-year onboarding
Create a structured onboarding journey: welcome email, orientation webinar, personal outreach at 30/60/90 days, and early engagement offers. First-year retention improvements of 8-12% are common.
Implement auto-renewal
Members on auto-pay renew 10-15% more often than those who must actively renew. Make it the default option.
Track engagement scores
Build a composite score (logins + event attendance + email opens + downloads). Members with low scores get proactive outreach before renewal time.
Segment renewal campaigns
Don't send the same renewal email to everyone. At-risk members need different messaging than highly engaged members.
Survey non-renewals
Ask lapsed members why they left. The patterns you find (cost, value, life changes) guide where to focus improvements.
For a comprehensive retention strategy, see How to Reduce Membership Churn: 10 Proven Strategies.
How i4a makes retention tracking easy
Accurate retention tracking requires the right technology foundation—software that captures the data you need, calculates metrics correctly, and surfaces insights without requiring manual spreadsheet work. i4a's membership reporting platform calculates retention automatically:
- Real-Time Dashboards: Rolling 12-month retention updated daily
- Cohort Analysis: Track retention by join year, membership type, or any segment
- First-Year Tracking: Separate reporting for new member retention
- At-Risk Alerts: Automatic identification of low-engagement members approaching renewal
- Benchmark Comparisons: See how you compare to industry averages
- Trend Analysis: Track retention changes over time
Key takeaways
- Basic formula: Retention Rate = (Members who renewed ÷ Members up for renewal) × 100
- 2025 benchmarks: According to the MGI Benchmarking Report, median overall renewal is 84% | First-year renewal: 75%
- First-year members renew at 9 percentage points lower than established members—track them separately
- A 5% retention improvement typically delivers 15-25% more revenue over 5 years (compounding effect)
- Track monthly, not yearly: Rolling 12-month retention catches problems faster than annual calculations
Start Tracking Retention the Right Way
See how i4a's association management software automatically calculates retention, identifies at-risk members, and helps you improve renewal rates.
Schedule a DemoRelated resources
Complete Guide to Membership Analytics
Master all aspects of membership measurement including cohort analysis and engagement scoring.
Comprehensive strategies to improve retention across the member lifecycle.
How to Reduce Membership Churn
Turn your retention insights into action with 10 proven strategies.
How to Design a Membership Dashboard
Build dashboards that surface retention problems early.