Quick Summary: Membership Analytics
- Track fewer, better metrics: Focus on retention rate, net growth, lifetime value, and engagement scores—a handful of well-chosen KPIs beats a sprawling dashboard.
- Build engagement scoring: Aggregate behaviors like event attendance, email clicks, and portal logins into a single score that predicts renewal likelihood.
- Predict churn early: Watch for declining engagement, email disengagement, and event non-attendance—intervene before renewal notices go ignored.
- Use cohort analysis: Compare members by join date, acquisition source, or behavior patterns to reveal insights hidden in aggregate numbers.
- Fix data quality first: Duplicate records, outdated emails, and inconsistent formatting corrupt every report—invest in cleanup before sophisticated analysis.
Most associations collect more data than they know what to do with. Member records, event attendance, email engagement, purchases, certifications—everything is in there somewhere, but often locked away in reports no one has time to interpret.
After three decades working with associations, I've watched this pattern repeat: organizations invest in systems that capture everything, then struggle to extract anything useful. The data exists. The insights don't—at least not automatically. The real opportunity is not gathering more data, but using what you already have to answer better questions and make faster, more confident decisions. This guide lays out a practical roadmap for using membership analytics to improve retention, grow high-value segments, and focus staff time where it has the greatest impact. An integrated association management system gives you the unified data foundation these insights depend on.
Why analytics matter for associations
Experience, relationships, and intuition still matter. Veteran staff often spot warning signs before any report does. But analytics offers something gut feeling cannot: evidence that scales, accountability that persists across staff turnover, and early detection of trends while you still have time to respond. MGI's 2025 Membership Marketing Benchmarking Report found that 52% of members who don't renew cite lack of engagement as their primary reason—a problem that proper analytics can identify and address before it's too late. The best membership platforms now include built-in analytics tools that make tracking engagement accessible to every association.
Higher retention at data-driven associations
More effective at identifying at-risk members
Improvement in campaign targeting accuracy
What analytics answer
- Retention: Which members are at risk? What interventions work?
- Acquisition: Which channels bring the best members? What's the true cost to acquire?
- Engagement: Which programs drive participation? What content resonates?
- Revenue: Which products perform? Where should we invest?
- Operations: Where are bottlenecks? What can we streamline?
Analytics requirements differ by organization type. Trade associations often need organizational-level analytics tracking corporate members and their employee contacts. Professional associations focus on individual member lifecycle metrics and credential tracking. AMCs need streamlined reporting workflows that can be replicated across multiple client associations efficiently.
The analytics maturity journey
Most associations live at Levels 1–2—basic reporting and simple trends—but aim for Levels 4–5, where prediction and automation make decisions proactive. True progress builds incrementally: each level strengthens the foundation for the next. Jumping ahead often leads to unreliable systems that fail when tested.
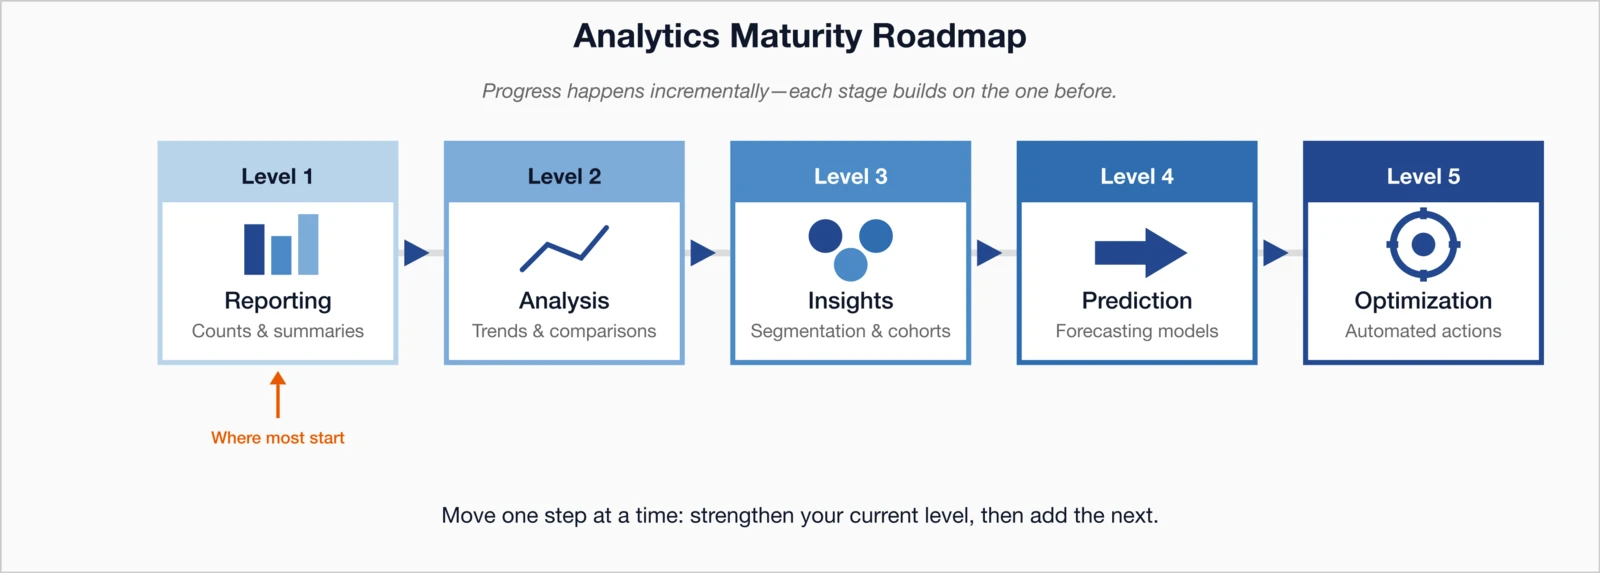
- Level 1 – Reporting
- Counts & summaries. Basic totals from your AMS—where 80% of associations start.
- Level 2 – Analysis
- Trends & comparisons. Year-over-year views and segment breakdowns to spot shifts early.
- Level 3 – Insights
- Segmentation & cohorts. Group members by join date, source, or behavior to reveal hidden patterns.
- Level 4 – Prediction
- Forecasting models. Use patterns to predict renewals, churn risk, and revenue before problems hit.
- Level 5 – Optimization
- Automated actions. Risk scores trigger emails, A/B tests refine offers, systems execute daily tactics.
Move forward one level at a time
Strengthen where you are before advancing:
- Level 1 → 2: Nail consistent reports, then layer on trends.
- Level 2 → 3: Master comparisons, then segment for deeper "why."
- Level 3 → 4: Prove insights work, then build simple forecasts.
Each step delivers faster decisions, not just prettier charts.
Deep Dive: Data-Driven Membership Decisions
Essential membership KPIs
The temptation is to track everything your system allows. Resist. A handful of well-chosen metrics beats a sprawling dashboard that nobody has time to parse. Focus on indicators that highlight emerging problems, validate strategies, and tie member behavior to organizational outcomes.
Core membership health metrics
Retention Rate
% of members who renew at end of membership period
Renewals ÷ Members Due for Renewal × 100
Target: 80-90% for healthy associations
Net Member Growth
Total membership change over period
New Members - Lapsed Members
Target: Positive growth year over year
Member Lifetime Value (LTV)
Total revenue from average member relationship
Avg Annual Revenue × Avg Tenure Years
Use for acquisition budget decisions
Customer Acquisition Cost (CAC)
Cost to acquire one new member
Marketing Spend ÷ New Members Acquired
Target: LTV/CAC ratio of 3:1 or better
Free Tool: Calculate Your Retention Rate
Not sure where you stand? See how your numbers compare to the 84% industry benchmark—and calculate the revenue impact of even small improvements.
Try the CalculatorEngagement metrics
Engagement is the single best leading indicator of renewal. Track it before it becomes a retention problem.
| Metric | What It Measures | Why It Matters |
|---|---|---|
| Event Participation Rate | % of members attending 1+ events | Event attendees renew at 2-3x higher rates |
| Email Engagement | Open rates, click rates by segment | Leading indicator of overall engagement |
| Login Frequency | Portal/community visits per member | Digital engagement correlates with retention |
| Benefit Utilization | % using each member benefit | Identify underused benefits for promotion |
| Net Promoter Score (NPS) | Likelihood to recommend membership | Predictive of retention and referrals |
Financial metrics
- Revenue per member: Total dues + non-dues revenue ÷ total members
- Dues revenue forecast: Expected renewal revenue based on current members
- Non-dues revenue ratio: Non-dues revenue ÷ total revenue (target: 40-60%)
- Event ROI: Net event revenue ÷ event costs
- Program profitability: Revenue minus direct costs by program
Deep Dive: Essential Association KPIs to Track
Deep Dive: Financial Reporting for Associations
Building an engagement scoring system
An engagement score aggregates multiple behaviors—event attendance, email clicks, certification progress, community activity—into a single number you can act on. It answers the question: who is deeply connected to this organization, and who is drifting away?
Engagement score components
Below is a sample scoring model. Adjust point values to match your specific programs—the behaviors that matter most should carry more weight.
| Activity | Points | Frequency |
|---|---|---|
| Annual conference attendance | +25 | Per event |
| Webinar attendance | +10 | Per webinar |
| Local chapter meeting | +15 | Per meeting |
| Online community post/reply | +5 | Per activity |
| Volunteer role | +30 | Per year active |
| Certification earned | +40 | Per certification |
| Email click | +2 | Per click |
| Portal login | +1 | Per login (max 10/mo) |
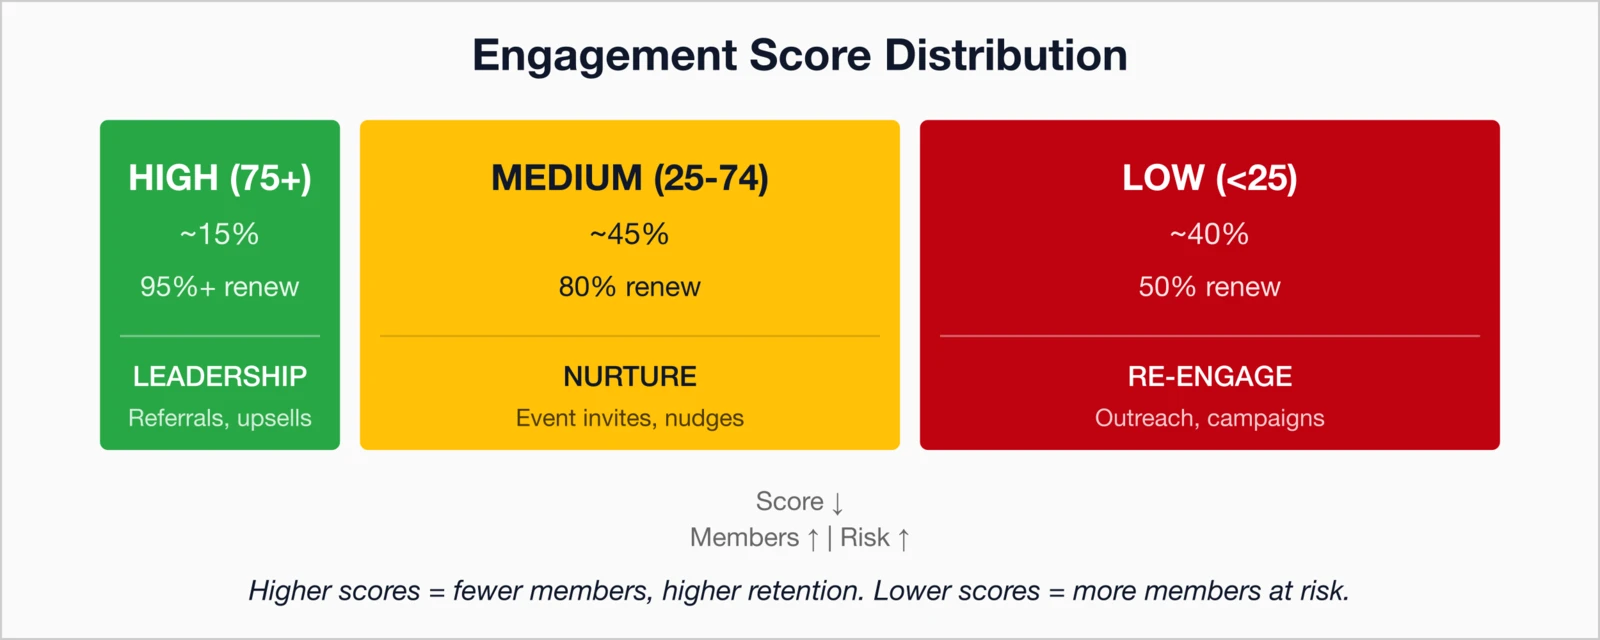
Score tiers and actions
Scores only matter if they trigger different treatment. Define thresholds and map each tier to specific actions. One of the most common mistakes I see associations make is building a scoring system, then letting the data sit in a report nobody acts on. The associations that get real value from engagement scoring connect it directly to workflows—automated emails for the middle tier, staff call lists for at-risk members, leadership invitations for top engagers.
Who they are: Active participants, likely to renew
Actions: Leadership opportunities, referral requests, testimonial collection, premium upsells
Who they are: Moderate participation, renewal probable
Actions: Targeted event invitations, benefit reminders, engagement nudges
Who they are: Minimal activity, at risk of lapsing
Actions: Re-engagement campaigns, personal outreach, exit surveys if lapsing
Predicting and preventing churn
The earlier you spot at-risk members, the more options you have. By the time someone ignores their renewal notice, the relationship has usually been eroding for months. Predictive signals let you intervene when goodwill still exists.
Churn risk indicators
- Engagement decline: Score dropping over 3+ months
- Email disengagement: No opens in 90+ days
- Event non-attendance: Attended previously, skipped recent events
- Benefit non-usage: Not using claimed benefits
- Complaint history: Support tickets, negative feedback
- Payment issues: Failed renewals, late payments
- Tenure patterns: First-year members have highest churn risk
Building a churn prediction model
You don't need machine learning to get started. A simple rules-based risk score can be assembled from existing data and run against every member monthly.
Sample Risk Scoring Rules
- First-year member: +20 risk points
- No event attendance in 12 months: +15 risk points
- Engagement score below 25: +20 risk points
- Email engagement declining: +10 risk points
- Failed payment in last year: +15 risk points
- No portal login in 6 months: +10 risk points
Members with 40+ risk points warrant proactive retention outreach
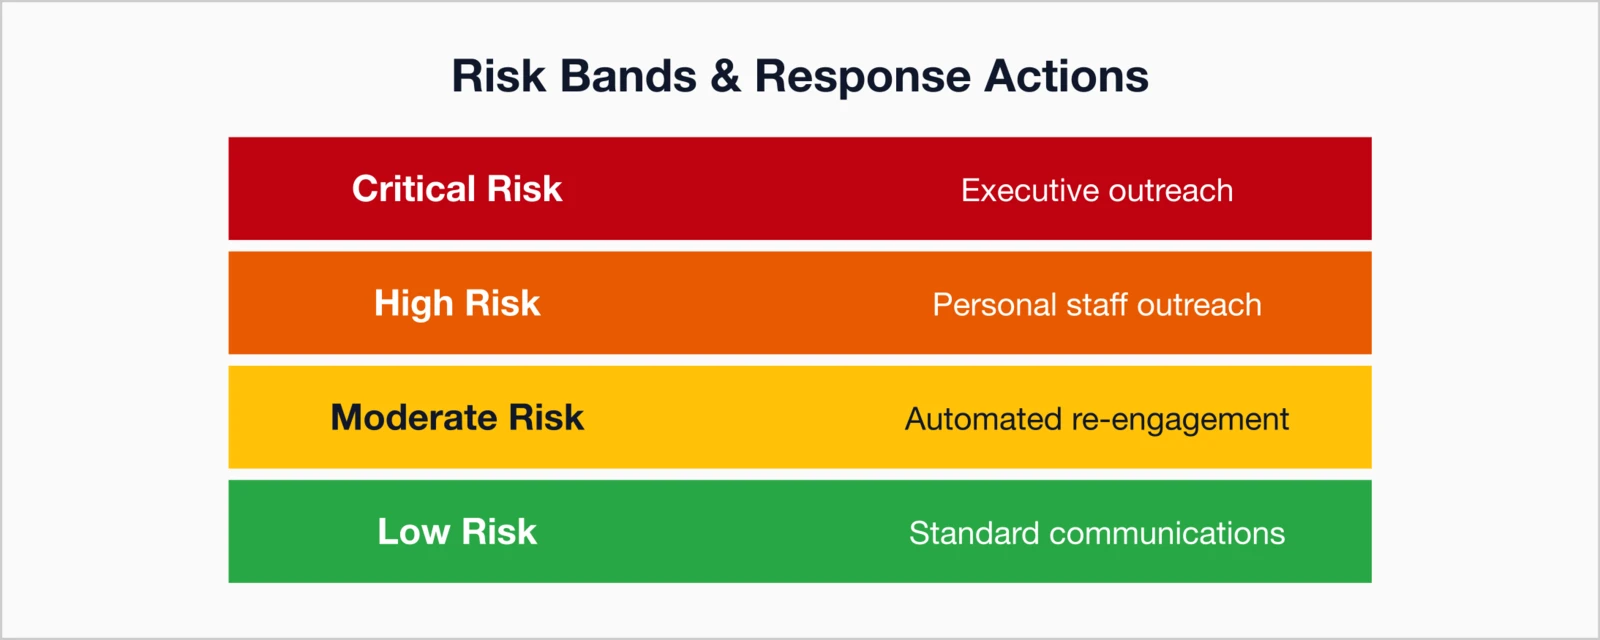
Intervention strategies by risk level
- Moderate risk (30-50 points): Automated re-engagement sequence, personalized benefit reminders
- High risk (50-70 points): Personal phone call or email from staff, special offer
- Critical risk (70+ points): Executive outreach, significant value-add offer, exit interview if lapsing
For detailed retention strategies, see our Membership Retention Guide.
Deep Dive: Predictive Analytics for Member Retention
Cohort analysis
Looking at aggregate retention hides the real story. Cohort analysis compares members who share something in common—the quarter they joined, how they found you, which benefits they use—so you can spot patterns invisible in blended numbers.
Join cohort analysis
Track retention by when members joined:
| Join Cohort | Year 1 Retention | Year 2 Retention | Year 3 Retention |
|---|---|---|---|
| Q1 2024 | 72% | 65% | — |
| Q2 2024 | 68% | — | — |
| Q3 2024 | 75% | — | — |
| Q4 2024 | 70% | — | — |
This analysis reveals that Q3 cohort outperforms others—investigate what was different about Q3 acquisition or onboarding.
Source cohort analysis
Understand which acquisition channels bring the highest-value members:
- Conference attendees: Often highest retention (already engaged)
- Referrals: Strong retention, lower acquisition cost
- Online campaigns: Variable quality, test extensively
- Partner promotions: May attract deal-seekers with lower LTV
Behavior cohorts
Group members by behavior patterns:
- Early engagers: Active within first 30 days (highest retention)
- Event-first: Join primarily for events
- Credential-seekers: Focused on certifications
- Passive members: Minimal engagement, renew for credential/access
Building effective dashboards
A good dashboard is not a wall of charts—it's a decision-support tool. Every metric should answer a question someone actually asks, and the design should surface problems before they require someone to dig.
Executive dashboard (board/leadership)
High-level health indicators:
- Total membership with trend
- Retention rate vs. target
- Net member growth
- Revenue vs. budget
- Member satisfaction (NPS)
- Key initiative progress
Operations dashboard (staff)
Actionable daily/weekly metrics:
- New members (today, this week, this month)
- Renewals due this week
- At-risk members requiring outreach
- Event registrations vs. capacity
- Support tickets and response times
- Email campaign performance
Dashboard design principles
- Lead with most important metrics
- Show trends, not just current values
- Include targets/benchmarks for context
- Use consistent color coding
- Enable drill-down for investigation
- Too many metrics (cognitive overload)
- Numbers without context
- Static reports vs. real-time data
- Pretty but not actionable
- Same view for all audiences
Deep Dive: Membership Dashboard Design Best Practices
Data quality foundation
None of this works if your data is unreliable. Duplicate records, outdated emails, and inconsistent formatting corrupt every report and erode trust in the numbers. The fix? Invest in cleanup before layering sophisticated analysis on top of a shaky foundation.
Common data quality issues
These problems show up everywhere—from bounced emails to wrong renewal forecasts:
- Duplicate records: One member, multiple accounts.
- Incomplete records: Missing emails, addresses, or demographics.
- Outdated information: Stale addresses or expired email domains.
- Inconsistent formatting: "VP Sales" vs. "Vice President of Sales."
- Missing activity history: Events or purchases not linked to the right member.
Data quality improvement process
Follow this simple sequence to build a stronger foundation:
- Audit your current state: Count records with issues (aim for <10% problems).
- Prioritize cleanup: Tackle email accuracy and duplicates first—they impact everything.
- Establish standards: Define required fields and formats (e.g., "First Last" for names).
- Implement validation: Block bad data at entry with dropdowns and required fields.
- Ongoing maintenance: Schedule quarterly cleanups and monitor new data.
Member self-service (your secret weapon)
Turn members into your cleanup crew. They know their own info best—and updating it often signals higher engagement.
- Easy profile updates: One-page portal form, done in 90 seconds.
- Annual prompts: "Confirm your details at renewal for seamless service."
- Incentives: Priority registration or exclusive content for complete profiles.
- Email verification: "Still at this address?" with one-click confirm/update.
Clean data isn't glamorous, but it's the difference between trusted insights and guesswork. Start small—fix emails first—and watch your analytics come alive.
Deep Dive: Data Migration Best Practices
Reporting best practices
Reports only matter if they change behavior. Build a reporting cadence that matches decision cycles, and present information in a way that makes the right next step obvious.
Report cadence
| Report Type | Frequency | Audience |
|---|---|---|
| Operational metrics | Daily/Real-time | Staff |
| Campaign performance | Weekly | Marketing team |
| Membership health | Monthly | Leadership |
| Strategic metrics | Quarterly | Board |
| Annual benchmarking | Yearly | Board, stakeholders |
Making reports actionable
- Lead with insights, not data: What does this mean? What should we do?
- Include comparisons: vs. last period, vs. target, vs. benchmark
- Highlight exceptions: What's significantly better or worse than expected?
- Recommend actions: Based on this data, here's what we should consider
- Track decisions: Document actions taken based on reports
Deep Dive: Board Reporting Best Practices
Frequently asked questions
Building a data-driven culture
Start small. Pick three metrics that answer questions you're actually asking, report on them consistently, and act on what you learn. Sophistication can come later—what matters now is building the habit of looking at evidence before making decisions, and tracking outcomes after.
The goal is not to automate judgment out of the equation; it's to give good judgment better inputs. Use data to spot problems earlier, validate what's working, and free up time for the relationship-building that still defines great associations. In my experience, the associations that succeed with analytics aren't the ones with the biggest budgets or the fanciest tools—they're the ones where leadership genuinely wants to know what's working and what isn't, and creates space for honest answers. That cultural commitment matters more than any dashboard.
Ready to unlock your member data?
See how i4a's built-in analytics dashboards help associations track engagement, predict churn, and make data-driven decisions—without complex BI tools or technical expertise.
Schedule a Free Demo