Membership Reporting & Analytics
See membership health at a glance with real-time dashboards. Build unlimited custom reports with filters based on fields in your database. Export to Excel, email to stakeholders, or link to your website—all without per-contact fees.
What's Included
All features included with every i4a subscription—no add-ons required
- Membership Metrics Dashboard
- Revenue Metrics Dashboard
- Real-Time Data
- Unlimited Custom Reports
- Advanced Filtering
- Saved Report Templates
- Link Reports to Website
- Export to Excel/CSV
- JSON & XML Exports
- Email Campaigns from Reports
- Scheduled Reports
- AR Aging Reports
- Retention Rate Tracking
- Revenue by Account
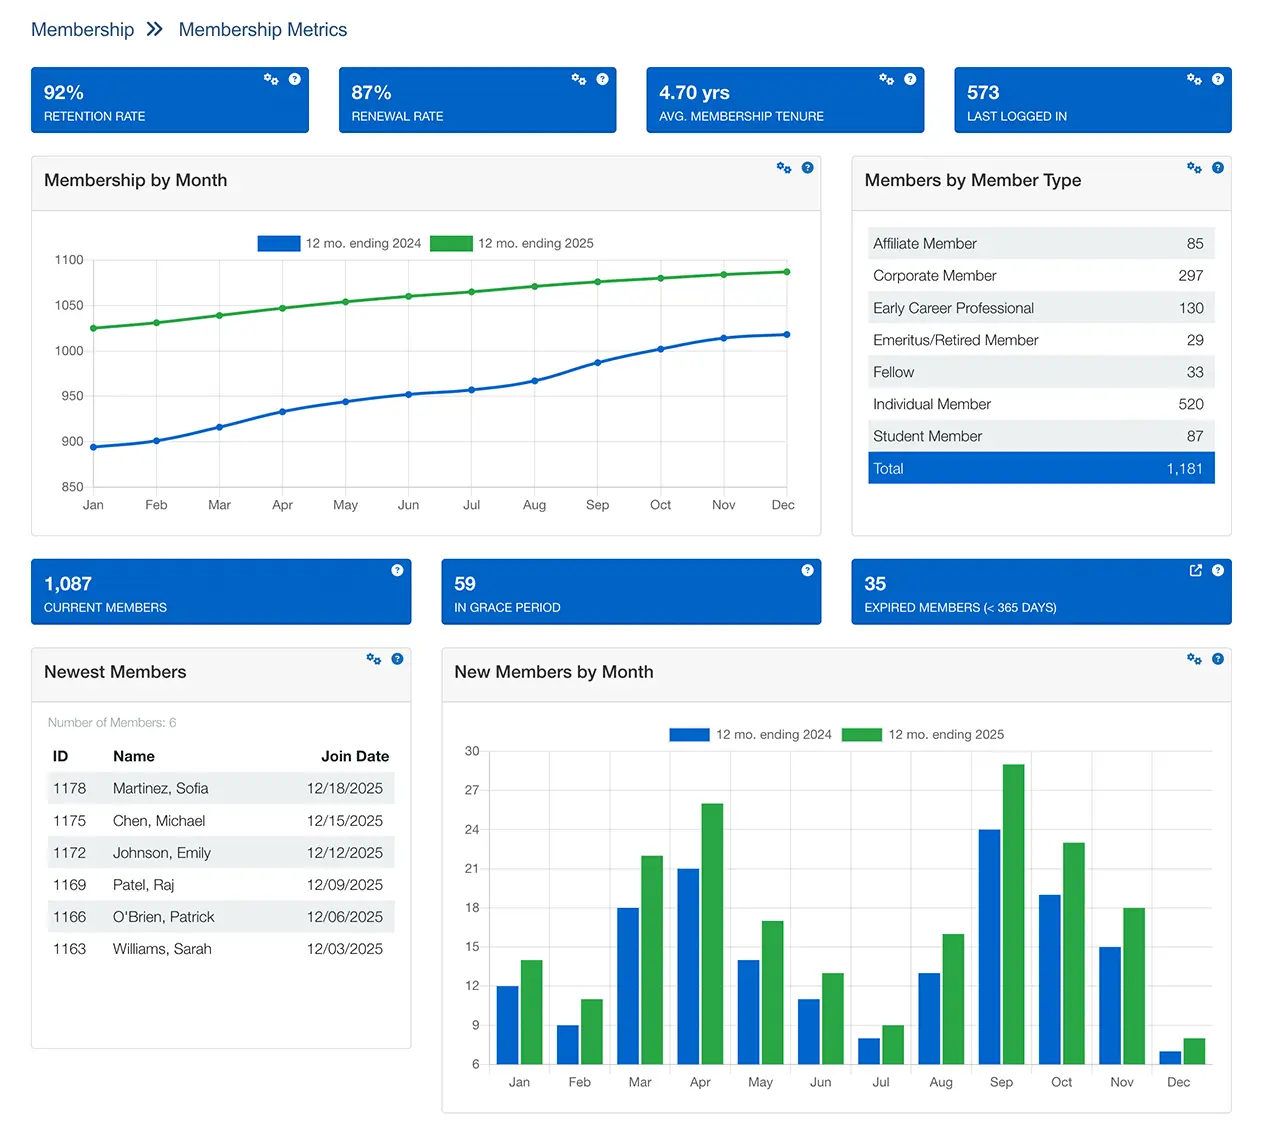
Membership Metrics Dashboard
Retention, renewal, tenure, trends
Revenue Metrics Dashboard
Dues, events, store, custom accounts
Unlimited Custom Reports
Customize included fields and set your own filters.
Advanced Filtering
Up to 10 filters with AND/OR logic
Export to Excel/CSV
Download data for analysis anywhere
JSON & XML Exports
For integrations and custom tools
Email Campaigns from Reports
Create your own custom email recipient lists
Link Reports to Website
Public directories and member lists
Real-Time Data
No waiting for overnight syncs
AR Aging Reports
30/60/90-day balance tracking
Retention Rate Tracking
Automatic calculations by period
Renewal Rate Tracking
See who renews by time period
Average Tenure Metrics
How long members stay
Visual Trend Charts
Compare year-over-year growth
Edit from Report Results
Click into member records to update
No Per-Contact Pricing
Flat rate regardless of database size
Jump to details:
Why Reporting Works Better When Integrated
No Manual Data Combining
Standalone reporting tools require constant CSV exports to combine member data with event attendance and purchases. i4a's reports pull from one database—members, events, payments, committees, and custom fields—without exports, imports, or manual merging.
Association Metrics, Not CRM Metrics
Most reporting tools show sales pipelines and conversion funnels. i4a's dashboards show what association leaders actually need—retention rates, renewal trends, tenure, revenue by dues vs. events, and grace period members ready for outreach.
Your Price Never Increases as You Grow
Per-contact reporting tools charge more as your database grows. Track 10,000 members or 100,000—your pricing stays flat. Build unlimited reports, export unlimited data, and never worry about hitting contact limits.
Real-Time Membership Metrics
Stop calculating retention rates in spreadsheets. The Membership Metrics dashboard shows retention, renewal, tenure, and trends automatically—updated in real time as members join, renew, or lapse.
What you'll see:
- Retention rate: What percentage of members you keep over time, calculated automatically for any period
- Renewal rate: How many members whose expiration date fell within a time period actually renewed
- Average tenure: How long, on average, members stay with your organization
- Membership by month: Visual charts comparing current vs. previous year
- New members by month: Track acquisition trends over 24 months
- Grace period members: See who's expired but still within grace—ready for targeted renewal outreach
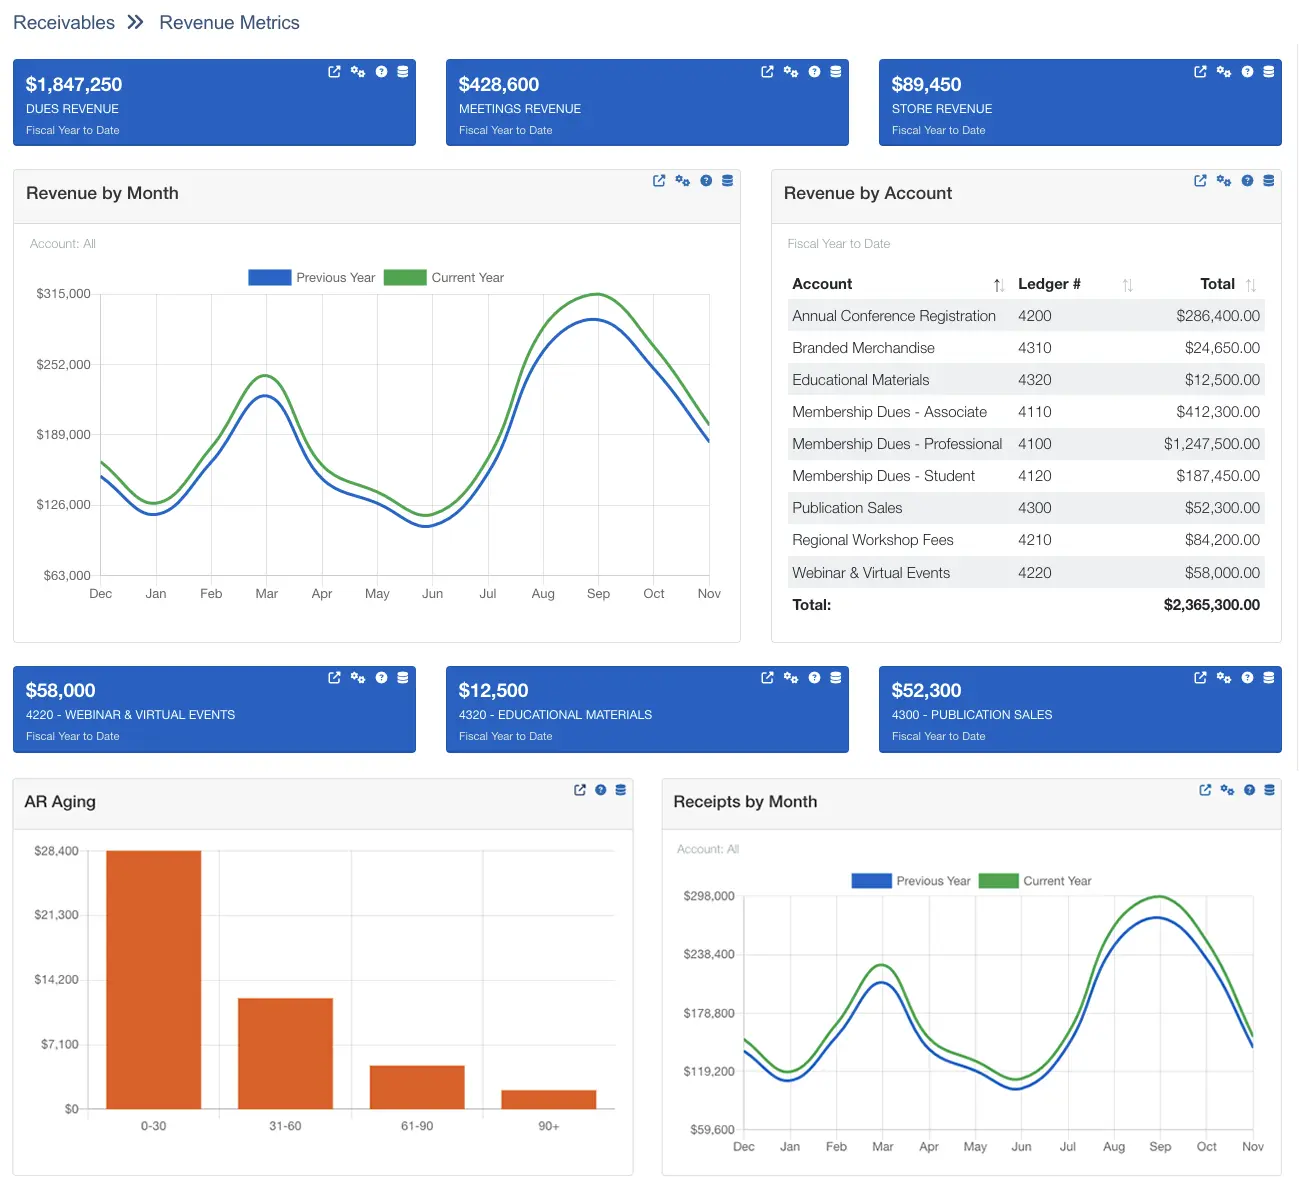
Track Revenue Across Every Income Source
Get a real-time view of income from dues, events, your online store, and any custom revenue stream you track—without digging through accounting exports.
What you'll see:
- Dues revenue: Total dues income from new joins and renewals, less cancellations
- Meetings revenue: Event registration income net of discounts and cancellations
- Store revenue: Online store sales excluding tax and shipping
- Custom account tracking: Pin up to 3 GL accounts to dashboard blocks (sponsorships, advertising, certifications)
- Revenue by month charts: Spot trends and compare current year to previous year
- AR aging reports: See outstanding balances grouped by age (0-30, 31-60, 61-90, 90+ days)
Flexible date ranges: Month to date, last month, fiscal YTD, past 12 months, or custom range.
Build Your Own Reports
No technical skills required—just select fields, add filters, and run
How Report Builder Works
Create unlimited custom reports in three steps:
- Choose data source: Select from pre-built views (contacts, members, registrations, activities, etc.)
- Select fields: Pick exactly which columns to display—names, types, expiration dates, addresses, phone numbers, custom fields
- Add filters: Up to 10 filters with AND/OR logic to target specific segments
- Run and export: View on screen, export to Excel/CSV/JSON/XML, or email as a campaign
Advanced Filtering Examples
Combine up to 10 filters to target exactly who you need:
- Geographic targeting: "Members in California OR Oregon"
- Engagement filtering: "Registered for this event OR this event AND member type = Regular"
- Renewal outreach: "Expiration date between 30-60 days from now"
- Committee service: "Serves on Education Committee OR Board"
- Custom field combos: "Certification = Active AND Interest = Leadership"
Get Data Where You Need It
Export to spreadsheets, share with stakeholders, or link reports to your website
Multiple Export Formats
Download report results in the format that works best for you:
- Excel (.xls): Opens directly in Microsoft Excel for analysis, charting, or pivot tables
- CSV (.csv): Universal format for importing into any spreadsheet or database tool
- JSON: Use report data in web applications or custom integrations
- XML: Integrate with external systems or databases
Link Reports to Your Website
Make select reports available to members or the public:
- Member directories: Let members search for other members by location or industry
- Sponsor lists: Display current sponsors with logos and links
- Award recipients: Showcase annual award winners
- Board member rosters: Public listing of current board leadership
- Mobile-friendly display: Reports linked on your site work beautifully on any device
Reporting & Analytics for Your Organization Type
See how associations like yours track metrics and report to boards
Common Questions
Explore Related Features
See how our integrated platform works together
Membership Analytics Guide
Data-driven strategies for understanding member behavior, predicting churn, and making informed decisions that drive growth.
Ready to Stop Paying Per Member?
See how i4a's all-in-one AMS with flat-rate pricing and unlimited contacts lets you grow your membership without increasing software costs. Schedule a 30-60 minute demo tailored to your organization's size and structure.