Quick Summary: Event ROI Measurement
- Attendance alone isn't enough: Assess who attended, how they engaged, and what value they received.
- Include all costs: Staff time often rivals direct event expenses when calculating true ROI.
- Track member impact: Conversions, renewals, and post-event engagement reveal strategic value.
- Report by audience: Deliver tailored insights to boards, sponsors, and staff to demonstrate value.
Part of our event ROI measurement guide
"How do we know if our conference was successful?" For associations, the answer starts with learning how to measure event ROI in a way that goes beyond gut feel.
Too often, the conversation stops at "attendance was good" or "people seemed happy." Those are encouraging signals, but they only scratch the surface. Your board, sponsors, and members deserve deeper insight—and you need solid data to justify the time, energy, and investment your events demand.
This need for better measurement is especially urgent. According to Sequence Consulting's 2026 Association Trends Report
For associations, measuring ROI is not just about revenue. It is about mission impact, member value, and community engagement—factors that do not always show up directly in financial statements.
This guide walks you through how to identify meaningful metrics, calculate real ROI, and share results in ways that resonate with your stakeholders.
After nearly three decades of helping associations run conferences and events, the most successful events are not necessarily the biggest—they are the ones where leadership can clearly articulate why they matter. When you can tie your conference directly to member outcomes, renewal rates, and professional advancement, you have built something worth investing in year after year. Associations that measure thoughtfully tend to plan more confidently.
Beyond attendance numbers
Attendance is the most visible event metric—and the most misleading when viewed alone. A conference with 500 attendees might be a triumph or a disappointment depending on who those people are and how engaged they were.
Industry benchmarking data shows 39% of associations rate their events and meetings as the second most effective channel for new member recruitment—right behind email. That makes it even more important to go beyond counting heads.
Better questions to ask about attendance
- Who attended? Members vs. non-members, first-time vs. returning
- What was the conversion rate? Registrations vs. actual check-ins (no-show rate)
- How did attendees engage? Sessions, networking, exhibits
- What's the trend? Growth or decline over time
- Did we reach our target audience? For example, young professionals or a niche specialty
Attendance quality metrics
| Metric | What It Tells You |
|---|---|
| Member attendance rate | Percentage of members attending; compare year over year. |
| First-time attendee % | Indicates event reach and recruitment impact. |
| Repeat attendee % | Suggests loyalty and perceived event value. |
| No-show rate | Reveals friction in registration or scheduling. Strong check-in processes help track this. |
| Sessions per attendee | Measures engagement depth—are attendees participating in multiple sessions? |
Pro Tip: Track whether members who skip the conference are more likely to lapse. If non-attendance predicts non-renewal, that's powerful evidence of event value.
Financial metrics
Most associations monitor registration revenue and direct expenses, but that view misses major hidden costs—and extra revenue streams—that shape the true ROI picture.
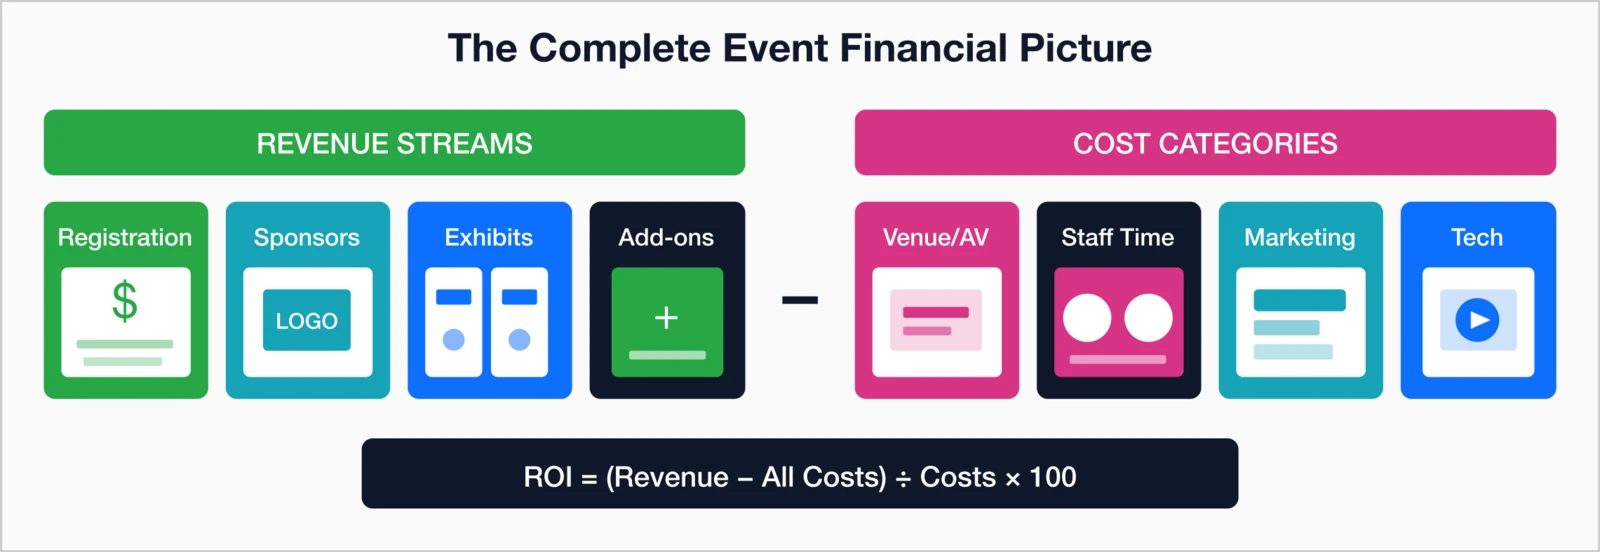
Revenue streams to track
- Registration revenue: Segment by tier and type (member, non-member, early bird, etc.)
- Sponsorships: Include both cash and in-kind
- Exhibits: Booth sales plus add-ons
- Advertising: Program book, app placements, signage
- Add-ons: Workshops, sessions, recordings
- On-site sales: Publications, merchandise, extra tickets
Costs to include (often missed)
- Staff time: Hours spent across planning, delivery, and follow-up
- Opportunity cost: What projects were delayed or dropped?
- Marketing spend: Campaigns, ads, creative assets
- Technology costs: Registration system, event apps, AV
- Volunteer time: Member contributions have value
- Speaker expenses: Honoraria, travel, thank-you gifts
- Attrition and cancellation fees: Venue or hotel penalties
A deeper look: The true cost of staff time
Staff time is the most underreported expense—and often one of the largest. A full view includes hours from your:
- Event director: Planning, logistics, vendor oversight
- Marketing coordinator: Campaigns, email, social media
- Membership team: Registrations, inquiries, follow-up
- Finance staff: Payments, refunds, reconciliation
- Executive leadership: Strategy, sponsorship relations
- Support team: Operations, materials, on-site help
Once tallied and multiplied by realistic hourly rates (with benefits), the total can rival what you pay for your venue. Don't forget to factor in opportunity cost—what else could your team have advanced if this event wasn't on the calendar?
To begin tracking, ask staff to estimate their hours for each event phase. Even rough data will reveal how much time—and therefore cost—your conferences truly command.
Engagement metrics
Engagement tells you how much value attendees actually received from your event—and that matters more than raw attendance numbers. When participants are actively involved, they're more likely to renew their membership, return for future events, and encourage colleagues to join. Engagement metrics move you beyond counting heads to understanding how deeply attendees interacted with your content, sponsors, and one another.
Strong engagement signals that your event is doing its job: connecting members, advancing learning, and reinforcing your community's sense of belonging. Whether your event is in person, virtual, or hybrid, these behavioral indicators reveal what worked, what fell flat, and how to make the next event even better.
Below are three key dimensions of engagement—session, networking, and digital—that together give you a full picture of attendee participation and satisfaction.

Session-level engagement
- Attendance vs. room capacity
- Retention: how many stayed for full sessions
- Q&A and chat participation
- Session and speaker ratings
Networking engagement
- Turnout at receptions or informal gatherings
- App usage and member-to-member messages
- Exhibit traffic and booth scans
- New connections reported post-event
Digital engagement (virtual/hybrid)
- Platform log-ins vs. registrations
- Time spent on platform
- On-demand views post-event
- Chat and poll participation rates
Member impact metrics
Member impact metrics connect your events directly to the heart of your association's mission: advancing your field and strengthening member relationships. Unlike financial or attendance metrics, these indicators capture the enduring value your event creates—how it influences engagement, learning, and retention long after the conference wraps up.
These measures take more time to capture, but they're the ones your board and executive team care most about. That's because they reveal whether your event delivered strategic outcomes, not just logistical success. Did it deepen member loyalty? Advance professional development? Strengthen your community?
When you track these metrics year after year, you start to see how your events fuel the membership lifecycle—from attracting new people, to renewing existing members, to re-engaging those who've drifted away. They show that your conference isn't just a one-time gathering—it's a driver of long-term membership growth, credibility, and mission impact.
Membership outcomes
- Non-member conversions: New joins within 90 days of attending
- Attendee renewal rate: Compare attendees vs. non-attendees
- Reactivated members: Former members who rejoin after attending
- Recruitment influence: New members referred by attendees
Professional development impact
- Credits earned: CEUs or CMEs completed
- Exam outcomes: If your event includes certification prep
- Skills applied: Survey attendees post-event about what they implemented
- Career outcomes: Long-term progression or promotions tied to event learning
Satisfaction and loyalty
- Net Promoter Score (NPS)
- Overall satisfaction ratings
- Intent to return next year
- Perceived value: Worth the time, cost, and travel?
A deeper look: Making NPS useful
Net Promoter Score (NPS) has become one of the most widely used measures of customer and attendee satisfaction—but for many associations, it's still underused or misunderstood. At its core, NPS gauges one simple but powerful idea: loyalty through advocacy. Instead of asking whether someone liked your event, it asks whether they'd recommend it to others. That shift in focus captures a stronger emotional signal of satisfaction and trust.
The standard NPS question asks: "On a scale of 0–10, how likely are you to recommend this event to a colleague?"
Responses sort into three categories:
- Promoters (9–10): Enthusiastic advocates who are likely to share positive word-of-mouth and return next year.
- Passives (7–8): Satisfied but unenthusiastic participants who could be swayed by competing options.
- Detractors (0–6): Dissatisfied attendees who may share negative feedback or choose not to attend again.
Your NPS is simply the percentage of Promoters minus the percentage of Detractors. The final score can range from –100 to +100. A positive score means more advocates than critics; a high score signals outstanding loyalty.
But the number itself is only a starting point. The real value of NPS comes from interpreting and acting on the insights behind it.
How to turn NPS into action
- Segment your results. Break down your NPS by audience type—first-time vs. returning attendees, members vs. non-members, or session track. This helps uncover who's truly engaged and who's at risk of disengagement.
- Collect the reasons. Always include a follow-up question: "What's the primary reason for your rating?" These open comments reveal what worked, what didn't, and which moments shaped attendee perceptions.
- Close the loop. Reach out personally to detractors. Listening—and responding with care—can turn critics into loyal participants while uncovering operational fixes you might otherwise miss.
- Track trends over time. A single score offers limited insight. But tracking NPS across multiple events shows whether attendee loyalty is improving, stable, or slipping—and what strategic changes move the needle.
Used well, NPS is more than a number—it's an ongoing feedback system that helps you strengthen member relationships, improve event experience, and prove the lasting value your association delivers.
Track Over Time: A single event's NPS doesn't mean much in isolation. But tracking NPS across multiple years reveals whether you're improving, maintaining, or declining.
Calculating true event ROI
ROI goes well beyond basic profit math. For associations, it includes both financial and mission returns.
Financial ROI formula
Include all costs—especially staff time—to get a true picture.
Member value ROI
Add member-centric outcomes to financial ROI:
- Non-member conversions × average member lifetime value (LTV)
- Retention impact: The value of renewals influenced by the event
Together, these give a more realistic measure of your event's total impact.
Sponsor ROI: What they care about
Make sponsor reporting easy by sharing:
- Impression totals (logo visibility, mentions)
- Lead data (scans, inquiries, downloads)
- Audience demographics (titles, company size, buying authority)
- Session metrics (attendance when sponsoring or speaking)
Reporting to stakeholders
Reporting on your event is not one-size-fits-all. Different stakeholders care about different questions: Was it financially sound? Did it move the mission forward? Did sponsors get value? Did members feel it was worth their time? When you tailor your reporting to each audience, your data becomes more persuasive, easier to understand, and far more useful for decision-making.
This is where good measurement pays off. By packaging the same core metrics in slightly different ways, you can give every group—your board, sponsors, staff, and members—the specific insights they need to judge success and support your next event.
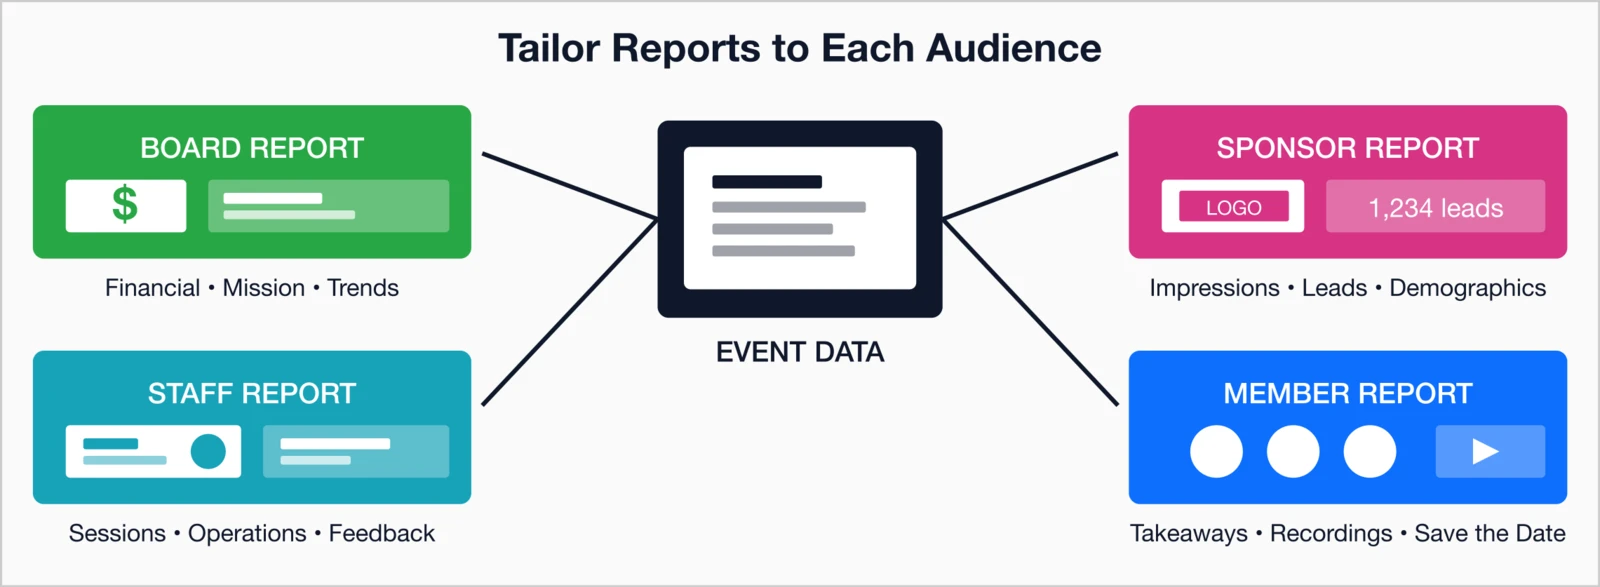
For the board
- Financial summary and net results
- Attendance trends year-over-year
- Member impact and conversions
- Strategic alignment with mission
- Recommendations for next year
For sponsors and exhibitors
- Attendee demographics
- Booth traffic and exposure metrics
- Lead quality and counts
- Package performance vs. expectations
- Testimonials from engaged attendees
For staff and committees
- Session performance reports
- Operational notes and solutions
- Vendor and venue evaluations
- Verbatim survey feedback
- Process improvements
For members
- Key takeaways and materials access
- On-demand recordings
- Next year's save-the-date
- Thank-you messages and recognition
Using data to improve future events
Data only matters if it drives action. Turn insights into impact through deliberate reflection.
Identify clear wins and losses
- Highest-rated sessions → reprise or expand
- Poorly rated content → rethink or retire
- Top registration channels → invest more
- Drop-off points → fix the conversion barriers
Benchmark against yourself
External benchmarks help, but internal trends tell the real story. Track:
- Attendance growth year over year
- Revenue per attendee
- Satisfaction trend line
- Early-bird share of total registrations
Build a continuous improvement loop
- Collect: Gather event data continuously.
- Analyze: Review within 30 days post-event.
- Prioritize: Focus on the 3–5 changes with the biggest impact.
- Implement: Integrate into next year's plan.
- Measure: Track whether the updates worked.
Integrated event management tools
Measuring what matters
Event ROI measurement doesn't have to be overwhelming. Start with core metrics—financials, attendance quality, and satisfaction—and expand as your analytics mature.
The key is consistency. One event's data point is interesting; multi-year trends are actionable. Build measurement into your event planning process from day one.
Your conferences are among your largest investments of time, money, and member attention. They deserve the same strategic rigor as any major initiative.
One pattern I've seen repeatedly since 1996: associations that track event-to-renewal connections become fiercely protective of their conferences. Once you can show the board that attendees renew at a significantly higher rate than non-attendees, the conversation shifts from "How do we cut event costs?" to "How do we get more members to attend?" That's a much better conversation to have.
For more practical frameworks, see our Association Event Management Guide
Key takeaways
- Attendance isn't enough: Assess who attended and how they engaged.
- Include hidden costs: Staff time often rivals direct event expenses.
- Engagement predicts value: Track session ratings, Q&A activity, and app usage.
- Measure member impact: Look at conversions, renewals, and engagement post-event.
- Calculate true ROI: Combine financial returns with member lifetime value.
- Make NPS actionable: Segment results, follow up, and track trends.
- Report by audience: Deliver tailored insights to boards, sponsors, and staff.
Get Better Event Data
i4a's event management tools track registrations, attendance, and member outcomes in one integrated system—giving you the data you need to demonstrate event ROI.
See How We Can HelpRelated resources
12-month checklist for planning successful conferences.
Event Registration Best Practices
Optimize registration to boost attendance and reduce friction.
Create sponsorship tiers that deliver value.
Association Event Management Guide
Complete guide covering event planning, registration, pricing, and execution.